There are many key aspects to urban centers being “green.” Our previous studies that aimed to identify the greenest U.S. cities considered those that were the country’s most sustainably powered, as well as the U.S. cities and metros that had achieved the most progress in terms of urban sustainability practices. This time, we turn to what is perhaps the most straightforward association of the term – parks and walkability. For this article, we looked at U.S cities with a population of at least 300,000 and ranked them by walkability metrics, data on park land totals, ratios, and investment, as well as by how each city fares on the air quality index (AQI) recorded by the E.P.A. Each metric is detailed in the methodology section.
The sudden restructuring of our social lives in 2020 has made it abundantly clear just how important walkability and park land are to the physical and mental wellbeing of our cities’ residents. It is understandably difficult to redress the currently uneven distribution of sizeable public green space in U.S. cities on short notice. It is the result of long-standing zoning practices that prioritized differently. However, improved access to parks is not only immediately possible, but also necessary. In fact, the most recent report released by The Trust for Public Land (TPL) noted that, during quarantine and lockdowns, public parks and lands across the country have seen significant upticks in visitors, amounting to some of their highest usage in modern times.
With that in mind, the summary below highlights the 15 cities that ranked highest by overall score, followed by a breakdown of the three cities that scored best for each individual metric we analyzed. Tables containing detailed scores and values for each of the 53 cities included in this study are available in the methodology section.
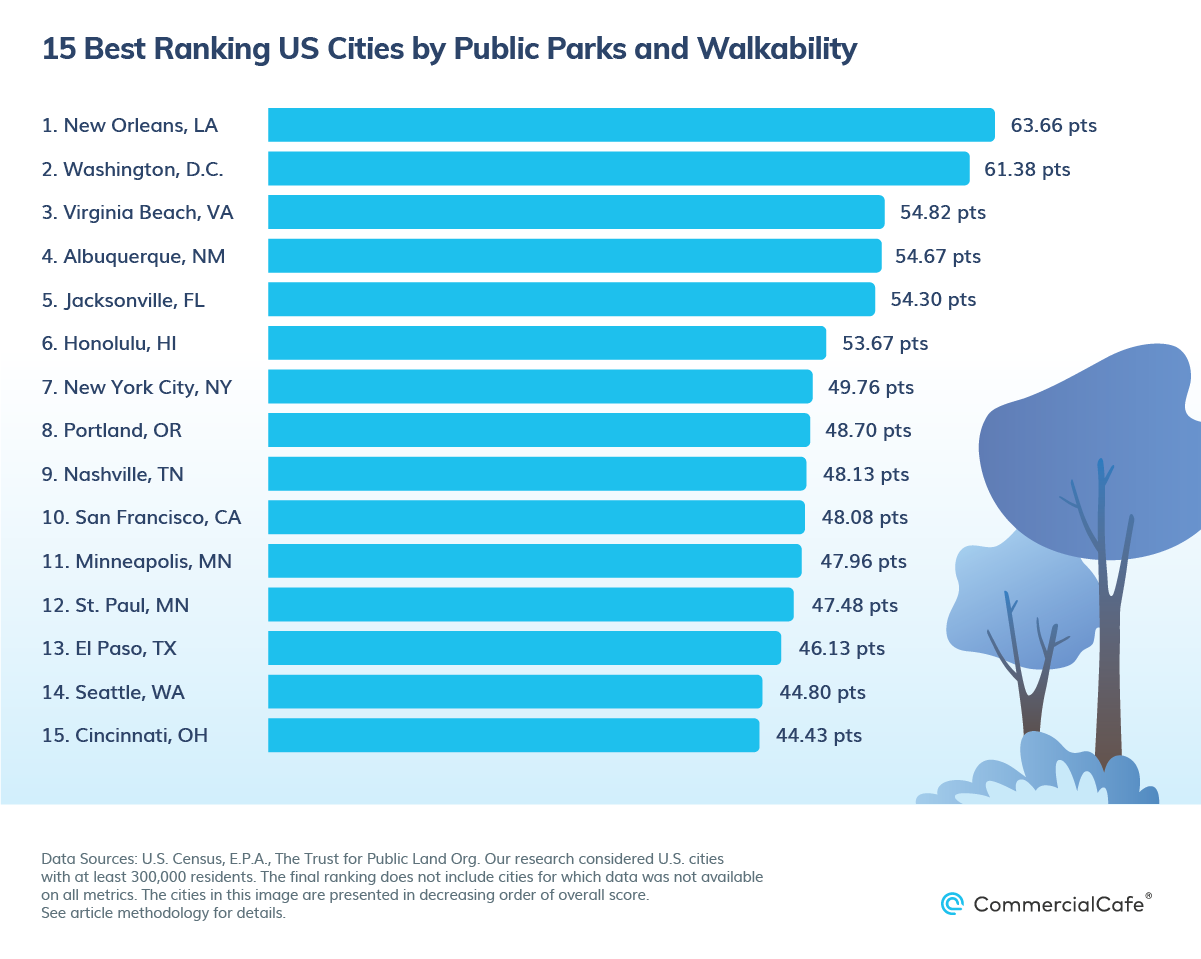
Top 15 US Cities by Public Parks & Walkability
Six of the 15 best-ranking US cities for public parks and walkability hail from the American South. Specifically, New Orleans earned the highest overall score — 63.66 points out of 100. Park land in the Big Easy accounts for roughly 26% of the total city area, which works out to about 72 acres of public park space per 1,000 residents. Furthermore, per-capita park spending in New Orleans amounted to just below $120 last year, which places the city in 21st place in the public and private park spending index. And, although it is not yet among the top cities for functional walking metrics, since 2008, residents have been increasingly foregoing personal vehicles in favor of walking, biking, and ride-sharing. According to 2018 Census data, 5.5% of New Orleans commuters chose to walk, with an average walk time of 17 minutes to get to work.
Washington D.C. earned the second-highest overall score, garnering 61.38 points out of 100. The national capital stood out for the share of its commuters who walk between home and work; the city’s percentage of land that is dedicated to parks; and the total number of trails strewn across its multitude of public spaces. Regional neighbor Virginia Beach, Va., landed in third, with a total score of 54.82 points. The Atlantic coast gem ranked well for its park-to-population ratio and for median air quality.
The other three southern U.S. cities in the top 15 mix are Jacksonville, Fla.; Nashville, Tenn.; and El Paso, Texas. Florida’s most populous city earned 54.30 points out of 100. Its vast park system earned the top score for ratio of park acres per 1,000 residents. The city also ranked fairly well for total public trails and for air quality. Nashville, Tenn., landed in ninth place out of 53, with an overall score of 48.13 points of 100. Its best-scoring features were a relatively short average walk time to work, a good park-to-population ratio and a high total trail count. El Paso, Texas, received a total score of 46.13 points, which placed the city in 13th place. The Texas city’s highest-scoring attributes in the study were its percentage of park land of city area and park acres per 1,000 residents ratio.
Albuquerque, N.M., was the highest-scoring of the four western U.S. cities that made the top 15. With a score of 54.67 points out of 100, the high desert New Mexico city is an outdoor enthusiast’s dream — more than 300 days of sunshine each year in which to enjoy the city’s nearly 300 parks. Portland, Ore., followed in eighth place with an overall score of 48.70 points. The Oregon city boasts some of the cleanest urban air in the country. It also scored fifth-best for per capita park investment, and is home to one of the 10 highest percentages of walking commuters among the cities in our list. San Francisco earned a score of 48.08 points to come in 10th on our list. Among the city’s many appealing qualities were its high percentage of park land of city area, as well the locals’ testament to walkability — San Francisco had the second-highest share of walking commuters. The fourth western U.S. city in the top 15 is Seattle, which ranked 14th out of 53, with an overall score of 44.80 points. Seattle earned the top score for per capita park investment, and also scored well for its percentage of commuters who walk to and from work.
Three midwestern U.S. cities earned top 15 scores — the Twin Cities and Cincinnati. Minneapolis and St. Paul, Minn., landed in 11th and 12th, respectively, with just under 48 points each. While St. Paul presents itself as one of the most walkable cities on the list, Minneapolis stood out for its generous funding of the local park system. Cincinnati received the 15th-highest score (44.43 points) with notable mentions for park investment, share of walking commuters and park-to-city area.
Honolulu earned the sixth-highest overall score with 53.67 points. The remote Central Pacific city benefits from the least polluted air among the cities on our list, boasts the fourth-best ratio of park acres to 1,000 residents and is home to a relatively high percentage of commuters who regularly walk.
New York City followed in seventh place with an overall score of 49.76 points out of 100. The city earned honorable mentions for its impressive network of trails, amount of per capita investment in public parks within the city limits, as well as the percentage of city area that’s dedicated to outdoor recreation. New York City also earned high marks for walkability, as demonstrated by the large percentage of commuters who choose to walk on a regular basis, as opposed to other forms of transportation.
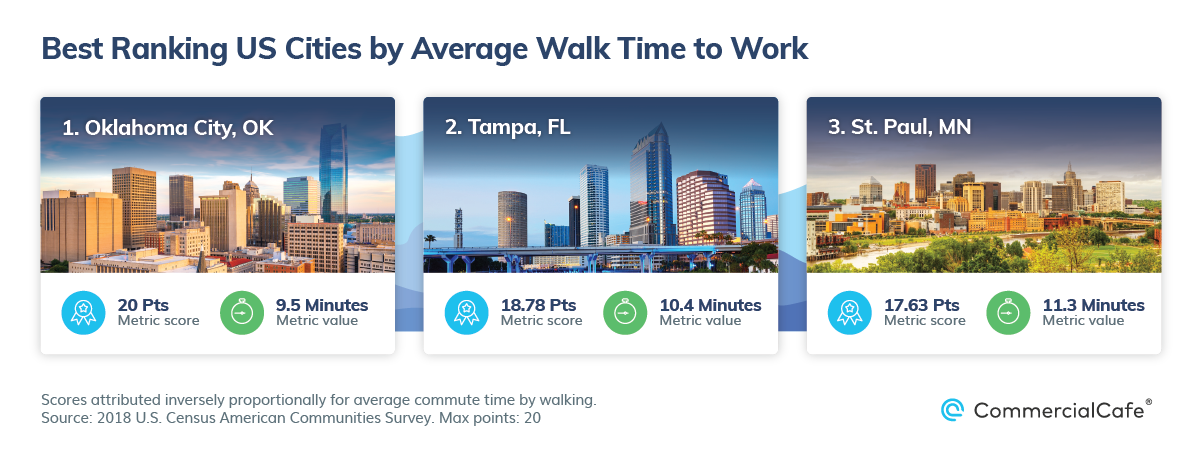
Top 3 US Cities by Average Walk Time to Work
Even before everything slowed down due to the pandemic, many U.S. cities had already started seeing increases in the number of biking and walking commuters. Notably, the benchmarking report released last year by the League of American Bicyclists showed that, since the project’s inception in 2007, commuting by bicycle had increased 50% across the country and commuting by walking had gone up 8%. This year, in particular, as scientists learned more about how to curb the spread of COVID-19, walking became the safest social distancing way to run errands or commute to and from work. So, in order to gauge where it would be most convenient to do so, we calculated average walking commute times for each of the cities on our list. Rankings are based on 2018 Census data gathered in the American Communities Survey (ACS).
Oklahoma City, OK
OKC made great progress in urban sustainability by investing more than $700 million in sidewalks, walking trails, bike lanes and additional paved pathways to help its residents get around the city without resorting to a personal vehicle. With an average walking commute time of 9.5 minutes, Oklahoma City scored the maximum of 20 points for this metric in our ranking.
Tampa, FL
While some neighborhoods are more walkable than others, Tampa fared quite well overall in terms of the time it takes for commuters to travel to their place of employment. The city’s average commute time to work came out to 10.4 minutes, which earned Tampa the second-highest score for this metric among all 53 cities included in the list. What’s more, local initiatives working together to motivate residents to commute without using cars have included bike-to-work challenges; walking tours that emphasize safe and convenient routes connecting neighborhoods; and public-private partnerships that award prizes to commuters who pledge to participate in improving the city and region’s commute to school and work.
St. Paul, MN
Ramsey County has long recognized the region’s potential to establish its communities as havens for walking and biking. In fact, a regional report released in 2018 on the state of walking and biking noted that investing in advanced walking and biking infrastructure would be returned in the form of increased access to jobs and education, as well as improve overall health and stimulate real estate and economic development. Granted, the city’s climate means that walking to and from work is not always ideal. But, when it is, the average walk time to work in St. Paul is 11.3 minutes, which places the city in the third-best spot for this index.
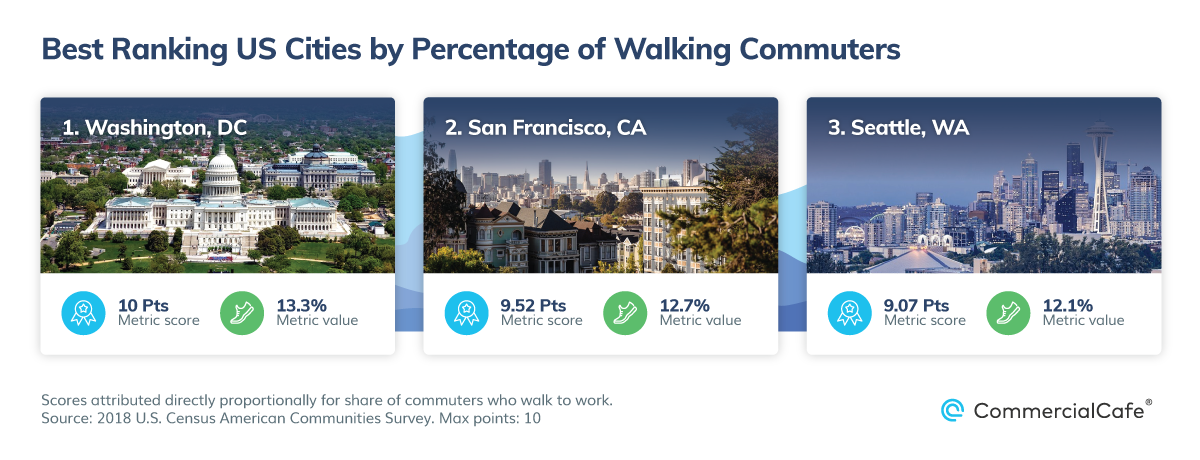
Top 3 US Cities by Percentage of Walking Commuters
Though more urbanites increasingly seek live-work-play environments where it’s convenient to live without a car, that possibility has not been equally available across all U.S. cityscapes. As such, some of the country’s densest urban centers are now weighing options to open up more walking space for their residents — whether by pedestrianizing thoroughfares, expanding sidewalks in lieu of on-street parking or transforming underutilized or undeveloped lots within city limits into additional green spaces. But, for the time being, we turned to 2018 ACS data and looked at the percentage of commuters who walked to and from work in their home town. The three best-scoring cities are listed below.
Washington, D.C.
The most recent data showed that just more than 13% of D.C. commuters found it most convenient to walk between home and work — the largest percentage of walking commuters of all of the cities on our list. Though it remains to be seen how commuting to and from office spaces in Washington, D.C. will occur going forward, it’s worth noting that, prior to the pandemic, the number of non-auto commuters in the city was rising. Moreover, the Transportation Planning Board of the Metropolitan Washington Council of Governments estimated that walking and biking trips in Washington, D.C., would increase 49% by 2045, which is larger than the projected increases for both public transit trips (expected to go up 38%) and personal vehicle trips (projected to grow 12%.)
San Francisco, CA
Of the city’s total commuters, 12.7% regularly walk to and from work in San Francisco. According to WalkSF, the city has significant yearly foot traffic from the more than 260,000 non-resident weekday commuters, as well as about 25 million visitors. To that end, April 16, 2020, was supposed to be the eighth local Walk to Work Day, an annual celebration of the city’s high walkability. However, due to COVID-19, this year’s city walking celebration was tentatively rescheduled to the fall.
Seattle, WA
According to the most recent American Communities Survey data, roughly 54,000 of Emerald City residents — about 12% of local commuters — walked to work in 2018. This was a notable notch up along a consistent trend of Seattleites forgoing solo vehicle travel around town. Meanwhile, Census survey data showed that, following generous investment to improve regional transit, more than half of Seattle residents now find it more convenient to walk, bike or use public transit than to drive.
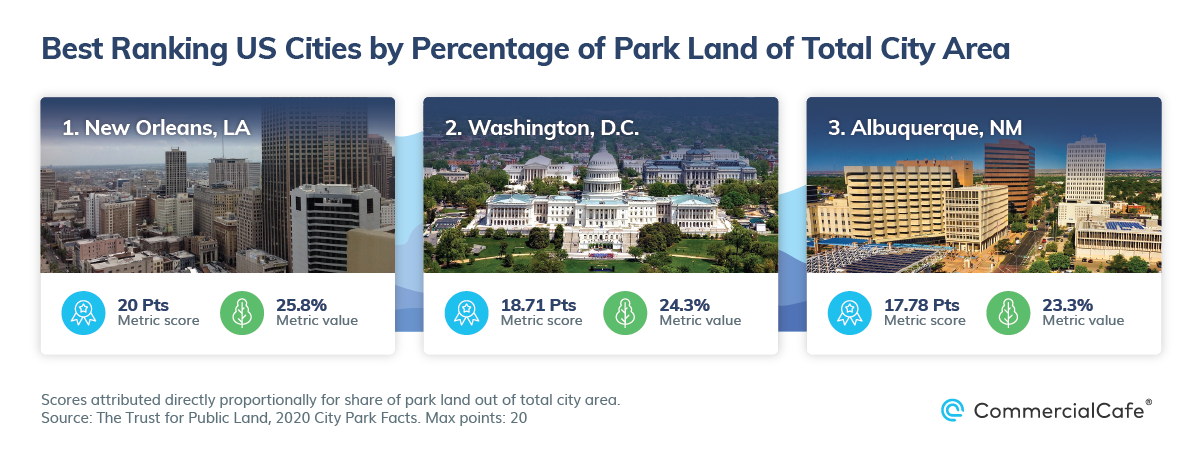
Top 3 US Cities by Percentage of Public Parks of City Area
The quality of the environments we occupy contributes greatly to our quality of life. This has been proven by recent studies, which have brought forward additional evidence that parks are significantly beneficial to our health — thereby reinforcing the need to plan for more generous proportions of urban green space in our modern environments. One example of such research is the work of Aaron J. Schwartz, et al. His work is based on “Hedonometer” data — a University of Vermont Complex Systems Center tool that analyzes 50 million tweets per day to gauge the national mood. As part of the study, the team reviewed tweets posted before, during and after visits to parks. What they found was that the happiness effect was markedly higher than the baseline at any time, not just during weekends or habitual vacation seasons. The research also noted that the effect was strongest — and lingered longer — after visits to parks that were larger than 100 acres.
New Orleans, LA
Incorporating more than 200 city parks of all shapes and sizes, park land in New Orleans accounts for nearly 26% of the total city area. NoLa is home to parks that date back to the 1800s; parks that pay homage to the iconic musicians born and inspired there; lake shore and river walk parks that offer a unique outdoor recreation environment; and much more.
Washington, D.C.
Washington D.C.’s public parks make up 24.3% of the city’s total area, which garnered a score of 18.71 points and landed the second-best spot in our ranking for this metric. The variety of D.C.’s public outdoor recreation spaces is unmatched between memorial parks; lush, landscaped gardens; aquatic gardens; vast museum green surrounds; urban habitats for native animal species; and some of the country’s first established park areas.
Albuquerque, NM
In Albuquerque, parks account for 23.3% of the total city area, earning it the third-highest score for this metric. According to TPL data, this New Mexico city is home to 384 parks, a recreational infrastructure to which nearly 90% of residents have optimal access: 87% of locals live within a 10-minute walk of a park.
Top 3 US Cities by Total Public Trails
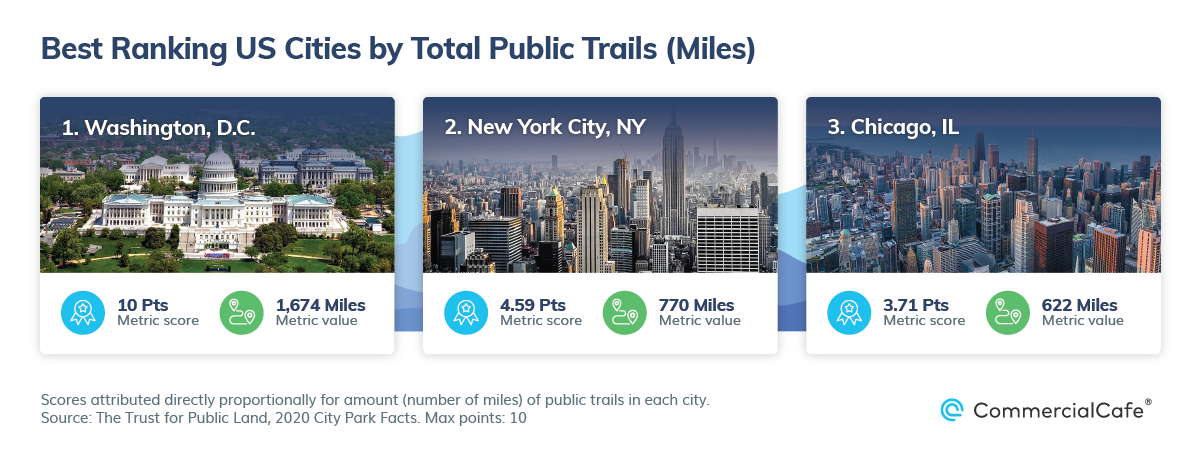
While some public park amenities remain unavailable due to COVID-19 restrictions, walking, hiking, jogging or biking trails within city limits have generally been available to residents looking to take advantage of the space and/or exercise while maintaining the recommended physical distancing. Plus, even the densest cities offer quality, scenic paths, and many of them are also accessible by foot, bicycle or public transit. And, depending on the individual park’s design, multi-use urban paths can actually reach surprising collective lengths. Therefore, for this metric, we scored the total distance of public trails — both natural and improved — that each city offers.
Washington, D.C.
In addition to its vast variety of outdoor recreational space, the nation’s capital also has a remarkable number of natural and improved trails. Specifically, the city is home to a total of 1,674 miles of trails, which garnered the maximum score of 10 points for this metric. Specifically, notable stretches of D.C. trails traverse the 1,700-acre Rock Creek Park retreat, the oldest urban park in the National Park Service.
New York City, NY
The term, “high density” in New York City applies to more than just its population — the city also packs in 770 miles of trails, both natural and improved, for the second-highest total among the cities on our list. New Yorkers’ development ingenuity and love of urban green spaces have resulted in projects like the iconic High Line, an elevated park on Manhattan’s West Side built along a historic freight rail line that was saved by neighborhood residents from demolition. This improved urban trail then spurred a flurry of construction, yielding some of the most desirable office space for lease in Chelsea. Clearly, NYC is home to much more than just Central Park. The city’s 30,000 acres of park land include beaches, marshes, wetlands and even whole forests, in addition to river scenery and inconspicuous hiking trails amidst the vast, bustling city.
Chicago, IL
The third-highest-scoring city in terms of total trails is Chicago, which earned 3.71 points out of 10 for its 622 miles of both improved and natural trails. In particular, the Lakefront Trail is one of the few outdoor recreational retreats that is open to Chicagoans at this time. Follow it south from Northerly Island for an 8.5-mile urban hike that encapsulates postcard views of the city’s central business district skyscrapers; sculpture parks; flora and fauna sanctuaries; woodland; and even a well-preserved snapshot of natural prairie.
Top 3 US Cities by Park Land Per 1,000 Residents
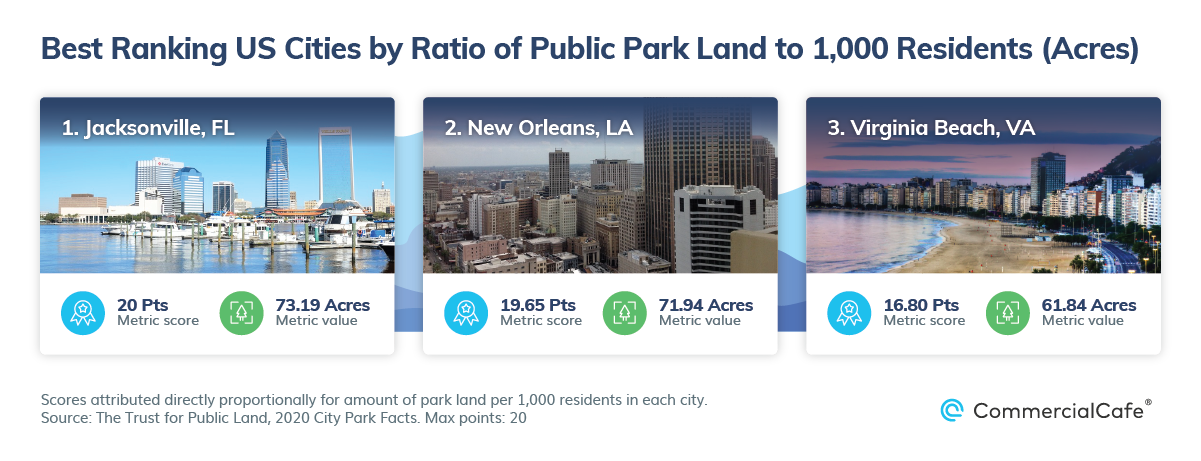
The land size and offerings of parks vary greatly across the country, as well as between local and regional parks and recreation agencies. While some serve areas that are home to just a few thousand people, others are a recreation resource for millions. However, the typical agency manages just under 10 acres of park land for every 1,000 residents in its jurisdiction — including open spaces like playgrounds, public building lawns and roadway medians. For this ranking of park land offerings at the city level, we looked at data gathered by The Trust for Public Land on park acres per 1,000 residents, which accounts for city, county, metro, state and federal park acres within city limits. The following were the top-scoring U.S. cities for this metric.
Jacksonville, FL
The most populous city in Florida — and largest by area in the contiguous U.S. — is also home to the largest park system in the country. Jacksonville’s park system offers a little more than 73 park acres per 1,000 residents, which ranked the city first for this metric and garnered the full 20 points. In particular, the system incorporates more than 400 city parks, seven state parks and three national parks, in addition to an arboretum and numerous landscaped gardens.
New Orleans, LA
The second-best score for park-to-population ratio on our list goes to New Orleans, which boasts nearly 72 acres of park land per 1,000 residents. The centrally located City Park alone spans 1,300 acres and includes a multitude of amenities and preserved monuments — both natural and cultural — in addition to a dozen soccer fields; two football fields; a 12-acre botanical garden; a centuries-old grove of oak trees, some of which are 800 years old; an equestrian center; a golf course; and much more.
Virginia Beach, VA
The state of Virginia’s largest independent city is home to a park system that includes more than 33,600 acres of park land and numerous recreational facilities. As such, Virginia Beach earns the third-best park-to-population ratio among the cities on our list, with just under 62 park acres per 1,000 residents. Plus, a generally mild year-round climate facilitates abundant use of the city’s park land and other outdoor recreational amenities — be it by land or water — on improved trails or natural hiking paths.
Top 3 US Cities by Park Spending Per Resident
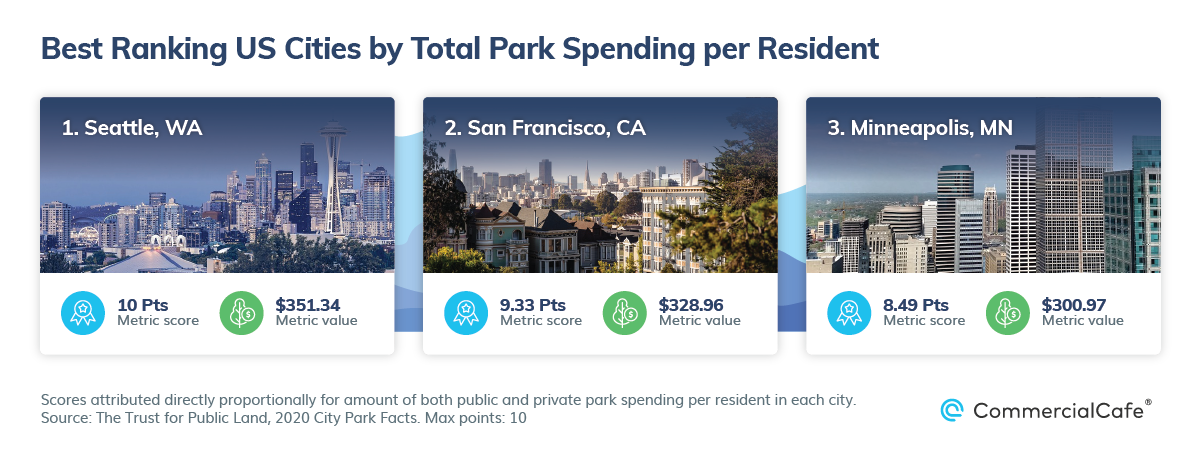
Parks do so much more for communities than just provide a pretty green space. Rather, the dedicated work of park and recreation professionals greatly contributes to increased quality of life for residents in every city. More precisely, funding for public parks supports services that range from maintenance of outdoor gathering places and trails to complex programming offerings — which can include special, themed events tailored to each community; hands-on teaching of new skills; support for STEM learning for children and young adults; and health and wellness education for visitors of all ages.
Seattle, WA
According to TPL 2020 City Park Facts, public and private park spending in Seattle amounted to roughly $351 per resident, the highest per capita investment among the 53 cities included in this ranking. It should come as no surprise, then, that a year ago, Seattle voters passed an $810 million, six-year tax levy intended to support the county’s parks, trails and other public open spaces. Roughly 40% of the levy will fund the maintenance of parks, trails and open spaces; 25% is focused on accessibility to parks and recreation; and the remaining 35% will be invested in improvements to several regional trails, as well as efforts to connect and increase regional open spaces.
San Francisco, CA
At $329 per resident, park spending in San Francisco placed the city second for this metric in our rankings. In fact, San Francisco’s investments in the city’s 471 parks and recreational spaces has been noted to have positive economic and social effects — and these are not limited to revenue from park visitors and the direct value to the overall wellbeing of the residents who use them. Rather, economic benefits include increased market values of properties located near higher-quality parks — for which residential, commercial and office space in San Francisco are notorious.
Minneapolis, MN
Public and private spending for Minneapolis’ 269 parks came down to roughly $301 per resident, which earned the third-highest score for this metric among the cities on our list. In fact, in 2016, Minneapolis embarked on a 20-year Neighborhood Park Plan, which seeks to undo the effects of years of underfunding of neighborhood parks. At that time, it also established the dedication of $11 million annually — on top of yearly budgets designated at the time — for improved maintenance, rehabilitation and capital investments. What’s more, the funding is based on a data-driven system that prioritizes racial and class equity.
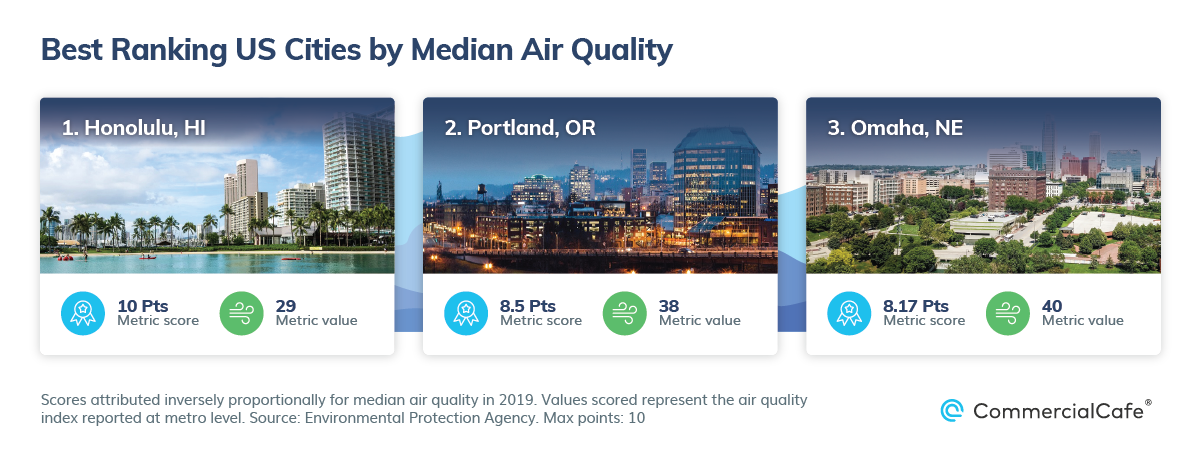
Top 3 US Cities by Median Air Quality
The air quality index is the Environmental Protection Agency’s main index for the quality of air across the country. The reported values run from 0 to 500, and higher values signify a greater level of air pollution that, in turn, poses more significant health concerns. However, more than half of the 53 cities included in our study report an AQI below 50, which corresponds to the “green” category and denotes satisfactory air quality whereby pollution poses virtually no risk. Such is the case for the three cities that scored best for this metric among the 53 included in our rankings.
Honolulu
Both the EPA and the American Lung Association agree that Honolulu has some of the cleanest air in the nation. With an AQI of 29, Honolulu has a high-quality aerial environment, although it is occasionally disrupted by volcanic smog (“vog”) when volcanic activity and unfriendly winds combine their powers over the city.
Portland, OR
Oregon has an established reputation as being among the greenest states in the country, despite seasonal setbacks with wood-burning smoke in the winter, as well as summer wildfires adding to the effects of busy roads. As a result, the EPA reported a median AQI of 38 for the city of Portland in 2019, with most days seeing values well below 30.
Omaha, NE
Omaha does fairly well in terms of keeping air pollution down. Of the seven pollutants that are monitored daily across Nebraska, two have been noted to still be in need of the most progress: particle pollution and ozone pollution. Even so, and with the occasional Saharan dust issues, Omaha still reported a median AQI of 40 last year to land a score of 8.17 points out of 10 for this metric.
Methodology
This third installment in our green cities series looked at both functional and leisurely outdoor movement potential in U.S. cities that have a population of at least 300,000 residents. Population totals referenced for city selection are according to U.S. Census estimates for 2018. This criterion was not factored into the scoring system. The final list of 53 incorporates only cities for which data was available on all factors analyzed.
For ranking purposes, we assigned composite scores based on several metrics. The maximum number of points for each metric was evenly distributed between the lowest and highest metric values. On this scale, a score was calculated for each city, based on its metric values. The factors (metrics) on which we based the composite scores are explained below.
For average walk time to work and for median air quality, the number of points awarded is inversely proportional to the metric values. For all other indicators, the number of points awarded is directly proportional to the metric values.
The first two metrics presented in the above and below tables were based on 2018 U.S. Census data from the American Communities Survey (ACS).
- We estimated the average walk time to work by using the intervals (number of minutes) provided by the Census. We then calculated the average for each city using the midpoint of each interval. The maximum weight for this metric was 20 points.
- The rankings for share of walking commuters of total commuters were also based on data collected by the U.S. Census’ 2018 ACS. Scores were awarded for the percentage of total commuters who walk to work in each city. The maximum weight for this metric was 10 points.
We turned to the 2020 City Park Facts data compiled and published by the Center for City Park Excellence, Trust for Public Land for the following four metrics:
- The percentage of park area of the total city area, for which the maximum weight was 20 points.
- The total amount, expressed in miles, of natural and improved walking trails within and in the immediate vicinity of each city. The maximum weight for this metric was 10 points.
- The ratio of total public city park land (acres) per thousand residents of each city. The maximum weight for this metric was 20 points.
- The total amount of public and private park spending per city resident. The maximum weight for this metric was 10 points.
Last, but not least, we also looked at air quality. Scores for this metric were attributed to AQI values recorded by the Environmental Protection Agency for 2019. Air quality data scored was only available at the metro level. The maximum weight for this metric was 10 points.

