Executive Summary
- Office sales volume drops 34% y-o-y, closes Q3 at $2.9 billion
- The average sales price per square foot reaches a 4-year high of $1,676
- Largest Q3 deals see The Coca-Cola Co. Building change hands twice for more than $900 million
- Asking prices for A+ office space leases average $101/Sq.Ft., A+ vacancy down to 5.4%
- Non-traditional office space approaches 17MSF in Manhattan
- Solar Carve Tower opens for business, 3MSF of office space scheduled for delivery in Q4
Despite picking up some steam in Q3, Manhattan office sales still fell short of 2018 values. The total dollar volume dropped 34% year-over-year, closing out Q3 at $2.9 billion. However, the average sales price reversed its downward trend and rose significantly, reaching $1,676 per square foot—the highest value in four years. Overall asking rents continued to increase, with trophy office space rates leading the way. Vacancy in office buildings equal to or larger than 25,000 square feet fell slightly compared to the previous quarter, reaching 7.1% overall. Non-traditional office space accounted for 3.4% of the total office inventory, encompassing nearly 17 million square feet. Additionally, a little more than 3 million square feet of new office space is slated for delivery in Q4. Read our full Manhattan Q3 office report below.
Manhattan Office Sales Drop 34% Y-o-Y in Q3
Following a sluggish first half of the year, sales activity in the Manhattan office market seems to be gaining some traction. At the close of Q3, office sales amounted to nearly $3 billion. On the surface, this marks a 49% increase in volume across roughly the same number of deals as Q2. However, the double sale of The Coca-Cola Co. Building, represented 64% of the total dollar volume. Also, the substantial surge in the average price per square foot masks the lowest total square footage traded on the market in the past four years. Eight deals encompassing a total of 1.7 million square feet closed during Q3.
Year-over-year, Q3 2019 failed to measure up to Q3 2018, and the total office sales volume dropped by 34%. This is not surprising, as one year ago the top two deals alone—the sales of Kushner Cos.’s 666 Fifth Avenue and Walt Disney Co.’s ABC Upper West Side headquarters complex—amounted to just under $2.5 billion. If sales activity doesn’t pick up steam in Q4, the market might be looking at the weakest year in terms of office sales since 2013.
Office Sale Prices Reach $1,676/Sq.Ft., Highest in Four Years
After dropping to a five-year low in Q2, average office prices rose 130% year-over-year and 201% compared to the previous quarter. Resting at $1,676, the price per square foot not only recovered from the slump, but it also reached its highest value in four years. While the double sale of The Coca-Cola Co. Building contributed significantly to the uptick in average price, it’s important to note that Q3 2019 also reversed a downward trend that started early last year. The price per square foot surpassed the $1,000 mark for the first time in five quarters.
Wafra Flips The Coca-Cola Building, Sells It Three Weeks After Purchase

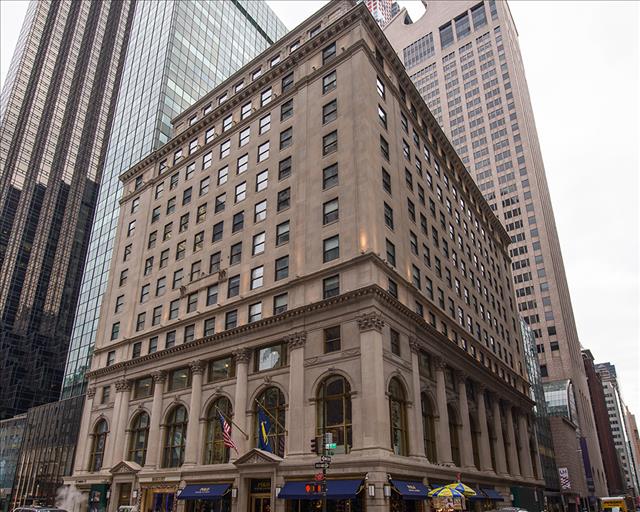
The Coca-Cola Company Building, 711 5th Ave., Manhattan, NY
In a controversial series of deals, Wafra purchased the iconic Coca-Cola Building at 711 Fifth Avenue only to sell the property three weeks later to SHVO, a previously rejected bidder. The transactions marked the two largest office sales of Q3.
A joint venture between Wafra Capital Partners and Nightingale Properties initially purchased the building from The Coca-Cola Co. at the beginning of September for $909 million. At the end of that same month, the property changed hands again for $937 million, acquired by a partnership between Michael Shvo and Serdar Bilgili. Deutsche Finance Group and German pension fund BVK backed the second deal.
Coca-Cola had owned the 313,000-square-foot building since 1983, when the company took over Columbia Pictures. Completed in 1927, the office property—which also features 56,000 square feet of retail and restaurant space—now houses tenants like Allen & Co. and Sandler Capital Management. Despite being known for its focus on residential real estate, SHVO plans to keep 711 Fifth Avenue as a commercial building. Nightingale will stay on as property manager.
Average Asking Price for A+ Office Space Leases Reaches $101/Sq.Ft.
The overall average asking rent for full-service office leases in Manhattan has also increased, reaching $82 per square foot at the end of September, 6% higher than it was at the close of Q2. As in the previous quarter, A+ office space saw the most significant surge in rents. Closing the quarter at $101 per square foot, the price increased by 7% compared to June. While Class A asking rents decreased slightly last quarter, they recovered in Q3. At $73 per square foot, the price is approaching values not seen since the beginning of 2018. Conversely, class B was the only category that saw a slight decrease in average asking rent, going from $63 per square foot at the end of June to $62 per square foot at the end of September. Class C office asking rents averaged $51 per square foot at the close of Q3.
Overall, office vacancy was 7.1% at the close of this year’s Q3, down from 7.5% in the previous quarter. The most notable increase in occupancy was seen with trophy office space. Class A+ properties went from 7% vacancy in Q2 to 5% at the end of Q3. Class A and Class C properties both decreased their vacancy rates, as well, wrapping up the third quarter with 9% and 6%, respectively. Class B properties, on the other hand, increased their vacancy by 0.3% to land at 7%.
Manhattan Coworking Office Space Inventory Nears 17MSF
Shared and coworking office space in Manhattan is steadily approaching 17 million square feet, reaching 16.8 million in mid-October, according to Yardi Matrix data. This marks a 4% increase since mid-July, when the category amounted to roughly 16.2 million square feet. The share of non-traditional office space within the Manhattan office market’s total inventory has also gone up slightly, now resting at 3.4%.
Solar Carve Tower Comes Online in Q3, 3MSF of Office Space on Track for Q4 Delivery
Only one office project was delivered to the Manhattan market during Q3, namely Aurora Capital and William Gottlieb’s Solar Carve Tower. Completed in July, the 139,000-square-foot building is located at 40 Tenth Avenue, between the Hudson River and the High Line. It was designed by Chicago-based Studio Gang and features a unique, geometric glass façade that maximizes the amount of sun the park will gets throughout the year. Tenants at the location already include RTW Investments on the seventh floor, Starwood Property Group on the eighth floor, and Hyundai’s Genesis, which occupies over 41,000 square feet of space, at ground level.
The pipeline for the remainder of 2019 consists of nine projects totaling 3 million square feet of office space. The largest project slated to be delivered by the end of the year is the David H. Koch Center for Cancer Care, which will feature nearly 1.2 million square feet of medical office space. 750,000 square feet will serve the Memorial Sloan Kettering Cancer Center, while the City University of New York’s Hunter College will take over the remaining 402,000 square feet.
Methodology
We used detailed Yardi Matrix data to analyze all office transactions with price tags equal to or exceeding $5 million to close in Manhattan during the third quarter of 2019. Our sales analysis, based on data recorded up until October 16, 2019, includes completed office buildings equal to or larger than 50,000 square feet that changed owners during the quarter. In the case of mixed-use assets, only properties featuring over 50% office space were taken into account. We counted portfolio deals as single transactions and excluded distressed sales altogether.
To make sure the trends and comparisons presented in our analysis are valid, we excluded portfolio, partial interest and ground lease deals from our calculation of the average price per square foot.
Lease rate, vacancy, and coworking space data refers to buildings equal to or larger than 25,000 square feet. Lease rates listed were averaged to the asking full service-equivalent rents per square foot for spaces recorded in Yardi Matrix as “available” up until October 16.
While every effort was made to ensure the timeliness and accuracy of the information presented in this report, the information is provided “as is” and neither CommercialCafe nor Yardi Matrix can guarantee that the information provided is complete.
Property images courtesy of Yardi Matrix.


