Last year, many office workers had to adjust to the reality of remote work on a previously unprecedented scale. Now, as many employees return to the office, some are considering the long-term implications of a remote or hybrid model. And, while news of the demise of Silicon Valley, New York and other major tech hubs has been greatly exaggerated, the pandemic has nudged workers who had previously considered moving to smaller urban areas into action.
However, decisions about relocation are always difficult, as many tech workers will still want to be close to a regional office and be part of an active local tech scene, even as they enjoy life at a slower pace. So, as pros and cons are weighed, it’s becoming apparent that some cities and metropolitan areas are better positioned — or, more intentional with their incentives — to attract tech workers.
Using data gathered by the U.S. Census Bureau and the Bureau of Labor Statistics (BLS), the following study focused on U.S. metropolitan areas with populations of less than 1 million residents and scored them across six indicators, including:
- Life quality (such as regional price parity, educational attainment and unemployment rate) – 25 points
- Tech job density – 30 points
- Average tech salary – 15 points
- Tech business density – 15 points
- Percentage of the total population covered by employer-based health insurance – 5 points
- Number of leisure establishments per 100,000 residents – 10 points
For more details about how these metrics are defined, as well as a list of all our data sources for this study, visit the methodology section.
Midwestern Metros Take Top 3 for Life Quality, Tech Job Density & Health Insurance Coverage
The top spots across the six indicators were distributed fairly evenly between the 15 entries that made the shortlist.
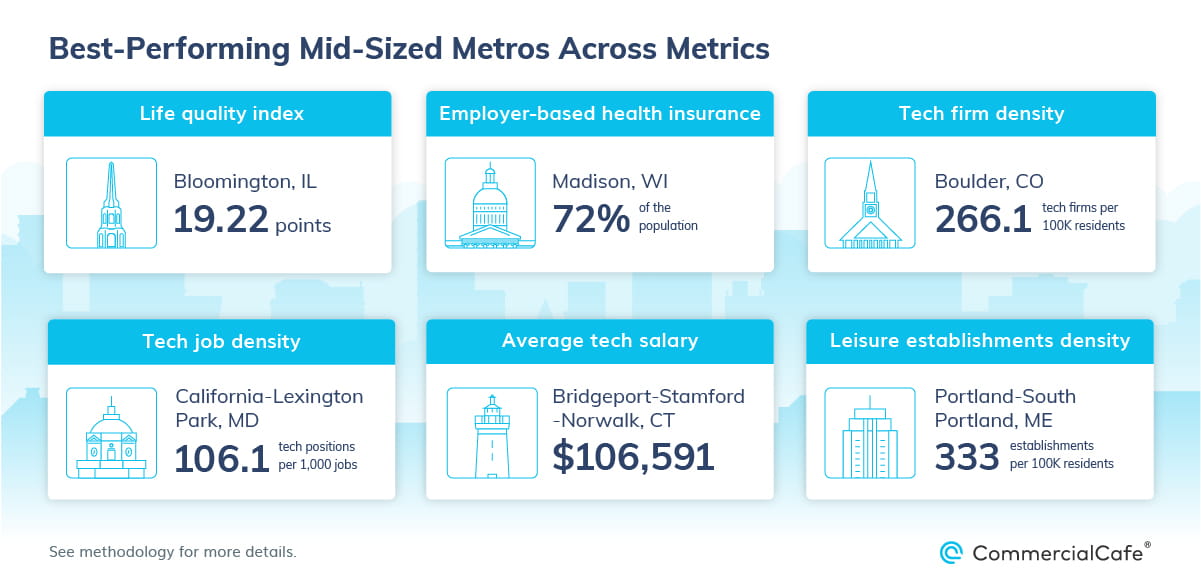
Boulder, Colo., garnered the highest score overall, landing in the first position for its number of tech establishments per 100,000 residents. It also made the podium across three other metrics, totaling 79.12 points.
Tech workers in the Bridgeport-Stamford-Norwalk, Conn., area enjoyed the highest average salary among the 15 entries, at $106,591 per year. The 943,332-strong metropolitan area also had a good concentration of leisure establishments and ranked 12th for tech density.
Midwestern tandems dominated a couple of indicators: The Madison, Wisc., and Ann Arbor, Mich., duo occupied first and second place for the highest percentage of population covered by health insurance, while the life quality index was topped by Bloomington, Ill., and Madison.
On the East Coast, the California-Lexington Park, Md., area took the lead in the tech job density rankings, while the Portland-South Portland, Maine, metro received the highest score for its share of leisure establishments.
But, as always, the scores of individual metro areas only reflect part of the story. For instance, while all entries have populations of less than 1 million residents, the dynamics behind a lower-than-average value for a particular metric are usually more complex and difficult to quantify. In other words, a lower density of tech establishments in a metropolitan area such as Charlottesville, Va., (population 218,358) looks different than it does in Albany-Schenectady-Troy, N.Y. — both because of the population gap and also because of various conditions on the ground.

With rankings in the upper half for four out of six metrics, Boulder amassed 79.12 points to earn the first position among metros with populations of less than 1 million. In particular, the metro performed exceptionally well in terms of average tech salaries — placing second with $101,319 per year — as well as density of tech businesses. Here, there were approximately 266.1 tech firms per every 100,000 residents in Boulder — 79% more than there were in the runner-up, California-Lexington Park, Md. Furthermore, some 86.9 of every 1,000 jobs in Boulder could be classified as tech positions, making the metro area the third-best in terms of tech job density. Unsurprisingly, Boulder has built a reputation as a big-tech playground.
But, however impressive its rankings may be across business-related metrics, thriving urban areas are more than just the sum of their economic opportunities. To that end, despite the shifting landscape of face-to-face entertainment, dining and cultural events, those who are interested in the delights of an effervescent scene will not be left out in the cold in Boulder: The area had the second-largest concentration of leisure establishments per 100,000 residents on our list, just behind Portland-South Portland, Maine.
Naturally, there’s still room for improvement, even in the case of a top-ranking metro like Boulder. For example, its life quality index earned it 17.2 out of a total of 25 points.
Are you a tech entrepreneur looking to start a business in a new location? Find your ideal coworking space in Boulder, on CommercialCafe.com!
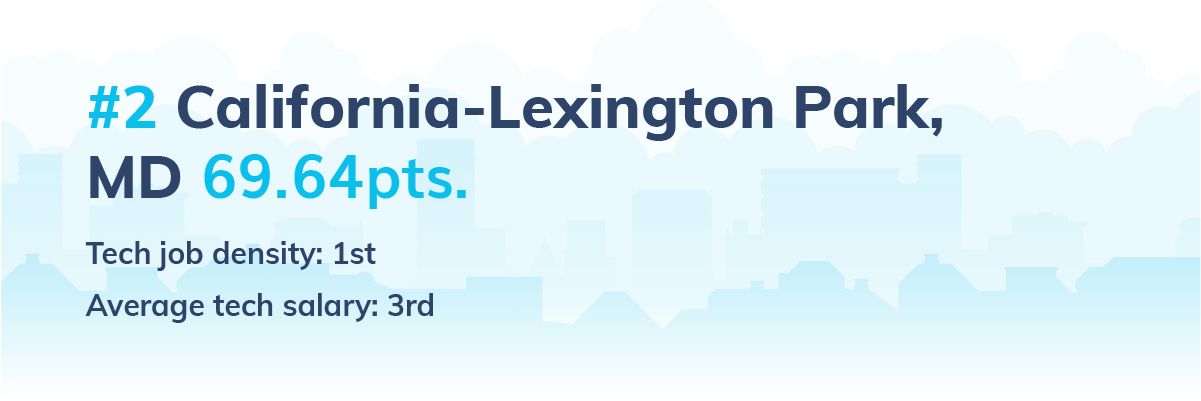
Boasting a total of 69.64 points, the California-Lexington Park, Md., area seesawed its way across the six indicators. Specifically, it topped the tech job density ranking, with 106.1 out of every 1,000 employment opportunities being within that field. The metro also received 12.96 out of 15 points for its average tech wage, which stood at $98,691 annually. Finally, California-Lexington Park also placed fourth and picked up another 5.91 out of 15 points for its number of tech businesses per 100,000 residents.
However, the Maryland metro area fell in the lower half of the list in terms of its life quality index, health coverage and density of leisure establishments. Additionally, approximately 60.4% of the population had employer-based health insurance, and the latest metro-wide Census data pointed to an unemployment rate of 4%.
It’s also important to mention regional particularities when assessing the share of tech businesses within a local economy. For instance, defense contractors play a major role in the Lexington Park market: As a result, large companies — such as Lockheed Martin or Raytheon — may also scoop up some of the STEM talent that tech companies try to tap into.
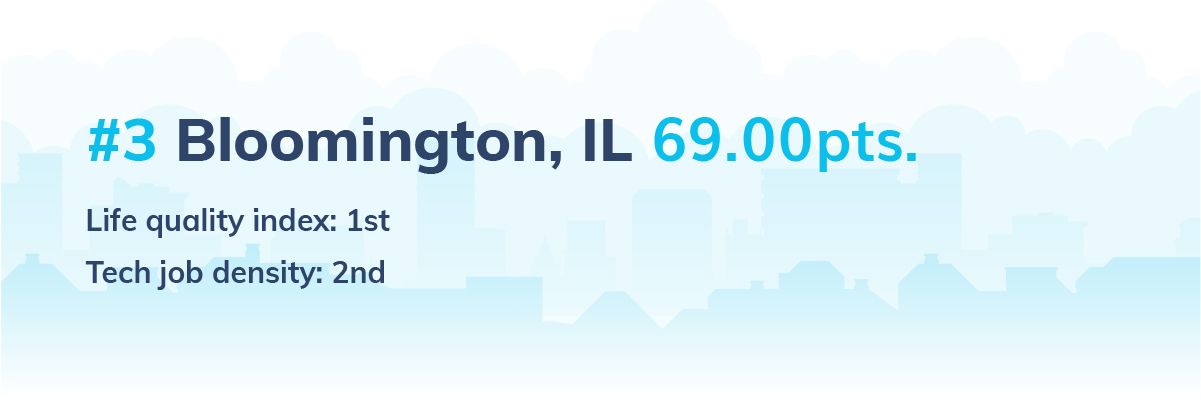
Around 50 of Bloomington, Ill.’s 69 total points came from its great performances across life quality and job density indicators, where it ranked first and second, respectively. What’s more, Bloomington also had an enviably low unemployment rate of 2.81% — outranked only by Madison’s 2.08%. And, tech workers looking to get the most bang for their buck will be glad to learn that the Illinois metro area ranked third for this metric.
Meanwhile, the average yearly tech salary in Bloomington was $86,808, ranking tenth among the top 15 metro areas. Here, tech workers made up 10.32% of the employed population in Bloomington, and their mean wages were roughly 60% higher than the metro average.
However, when it came to the number of tech firms per 100,000 residents, Bloomington garnered a mere 3.16 out of 15 points. That’s because business density for this industry was nearly half of that in California-Lexington Park, Md., which was the closest metro area on the list in terms of population.
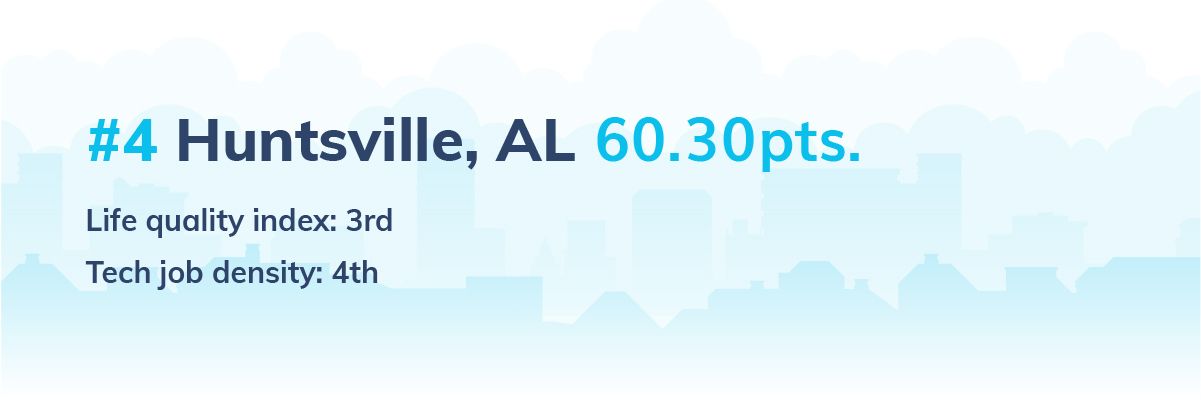
In fourth place, Huntsville, Ala., earned 60.30 points. Notably, the metro area performed relatively well for the weightiest metrics: It received 18.56 out of 25 points on the life quality index, as well as 20.65 out of 30 points for its tech job density, ranking third and fourth, respectively.
Here, 7.35% of the area’s 232,990 employed residents occupied tech positions, with mean yearly wages that were 61.54% above the metro-wide average. And, with its $88,681 average, Huntsville placed seventh for tech salaries. In terms of employer-based health insurance coverage, Huntsville’s 62.1% placed it within the top 10.
Are you a tech entrepreneur looking to start a business in a new location? Find your ideal coworking space in Huntsville, on CommercialCafe.com!
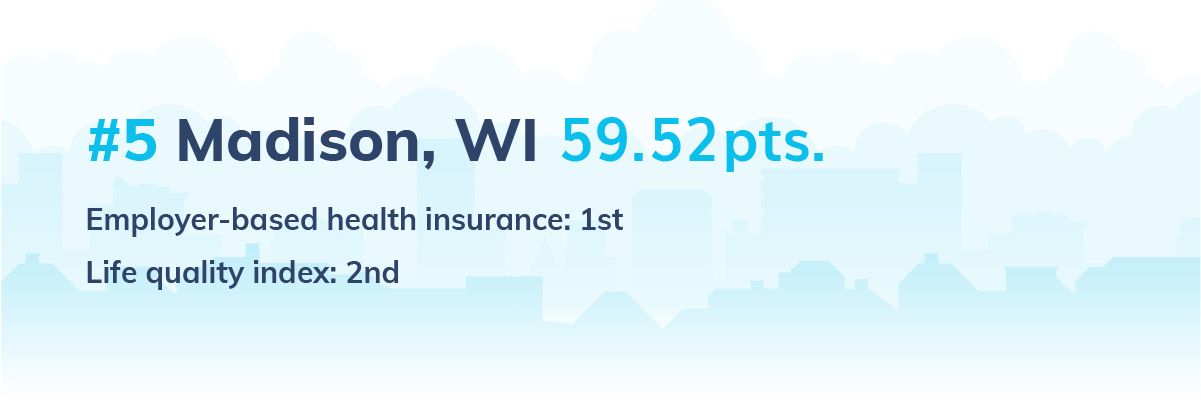
The Wisconsin metro area gathered 59.52 points, earning the top spot for its total percentage of workers with health coverage.
Every 62 out of 1,000 jobs in Madison fell within the tech category, making it the sixth-best-performing metro area for this indicator and receiving 17.38 out of 30 points. Plus, the mean wage for those working in the tech industry revolved around $83,296 per year — 50% higher than the metro-wide average salary.
Yet, despite the presence of big names such as Google, Microsoft and Zendesk, Madison received only 4.91 out of 15 points for the number of tech firms per 100,000 residents. Nevertheless, the metro is serious about nurturing its potential as a tech hub. In fact, in 2018, it was ranked as one of the top 10 cities for Millennial entrepreneurs.
Meanwhile, coming in fifth in terms of educational attainment level — with 48.61% of residents with bachelor’s degrees or higher — Madison offers an enticing talent pool. Its 2.08% unemployment rate was also the lowest among the top 15 metro areas. Overall, Madison collected 19.01 out of 25 points for its life quality index.
Are you a tech entrepreneur looking to start a business in a new location? Find your ideal coworking space in Madison, on CommercialCafe.com!
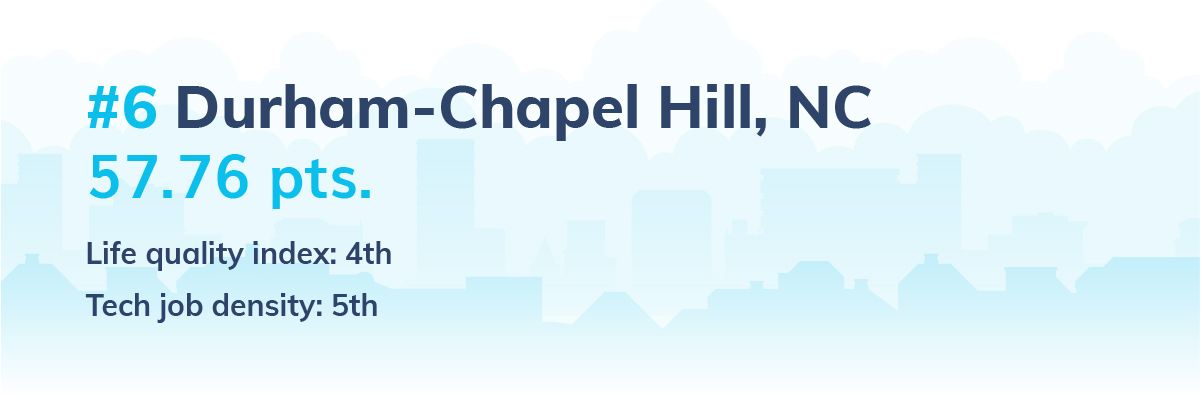
Durham-Chapel Hill picked up 57.76 points, primarily for its above-average performances across the life quality index, tech salary and job density indicators. According to BLS data from 2019, there were 65.7 tech positions for every 1,000 jobs in Durham, with a mean annual salary of $90,133. The tech firm density per 100,000 residents stood at 81.2, adding 4.52 points to the metro’s overall score.
In terms or leisure opportunities in Durham, there were 194.6 firms per 100,000 residents, ranging from restaurants to museums, stadiums and concert halls.
Are you a tech entrepreneur looking to start a business in a new location? Find your ideal coworking space in Durham or Chapel Hill, on CommercialCafe.com!
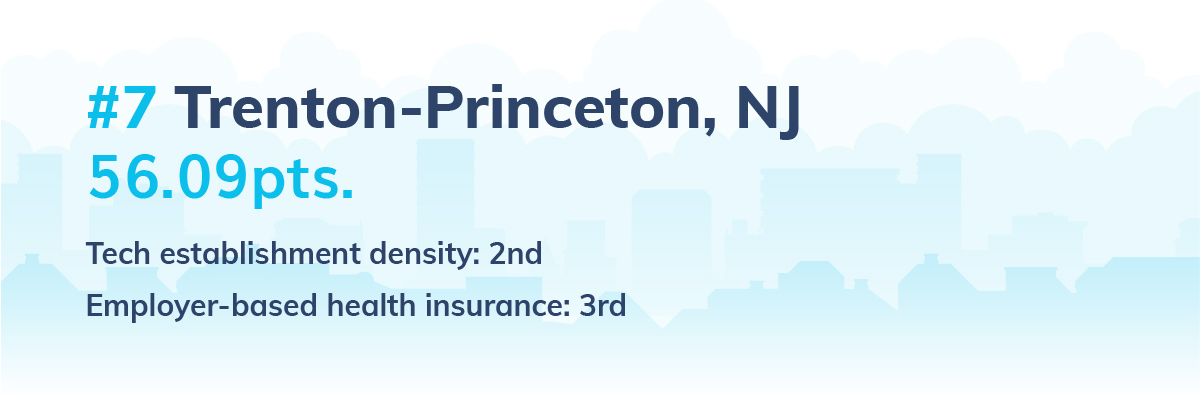
Trenton-Princeton, N.J., totaled 56.09 points, occupying the 7th place with notable achievements across several metrics. With an average tech salary of $96,834 per year, this metro had the fourth-highest score, just behind Bridgeport, Conn.; Boulder, Colo.; and California-Lexington Park, Md. It also received the second-highest score for its tech business density, with 148.3 such establishments per 100,000 residents. However, the high density in tech firms does not necessarily translate into an above-average concentration of jobs, as there were 48.9 tech positions for every 1,000 openings. That’s less than half of what we saw in the upper half of the ranking for this indicator.
Here, 68.4% of the population benefitted from employer-based insurance, and there were 233.8 leisure establishments per 100,000 residents in Trenton. When it came to its life quality index, Trenton’s low score was a result of modest performances in terms of both its unemployment rate — 5.43%, the second to last on the list — and regional price parity.
Are you a tech entrepreneur looking to start a business in a new location? Find your ideal coworking space in Princeton, on CommercialCafe.com!
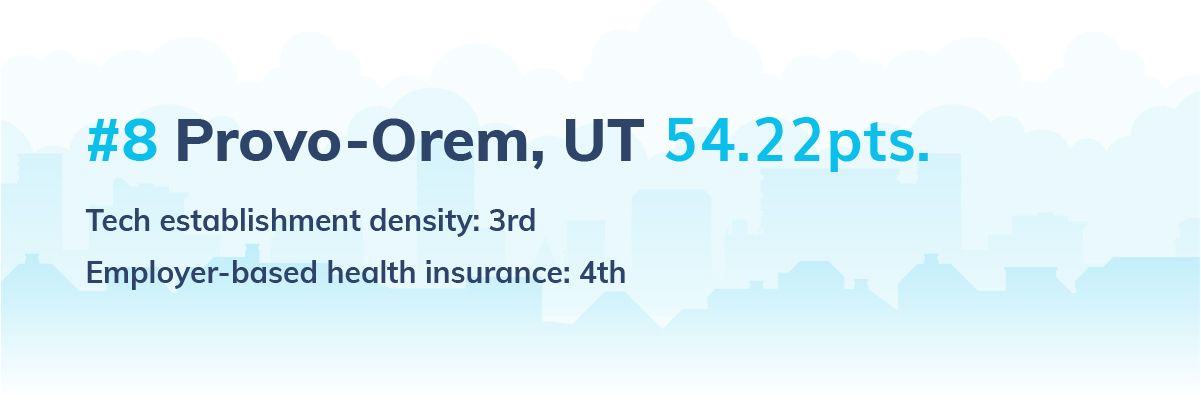
With a total of 54.22 points, Provo-Orem, Utah, recorded solidly average performances across most of its metrics. For instance, it grabbed third place for tech business density, as there were 108.4 such establishments for every 100,000 residents in the metro. Likewise, roughly 56.4 of every 1,000 jobs in the Utah metro area were classified as tech occupations, with the average tech income at $87,045 per year. Remarkably, Provo-Orem sported the highest discrepancy between the average metro-wide salary and the average tech salary within the top 15: For this metric, the average tech salary was 68.96% higher than the average metro-wide salary.
Meanwhile, Provo-Orem scored 17.23 points on its life quality index, placing fifth in terms of regional price parity. In 2019, unemployment rates averaged 3.43%. Finally, approximately 68% of Provo-Orem residents had health insurance through their employer, boasting the fourth-largest coverage on the list.
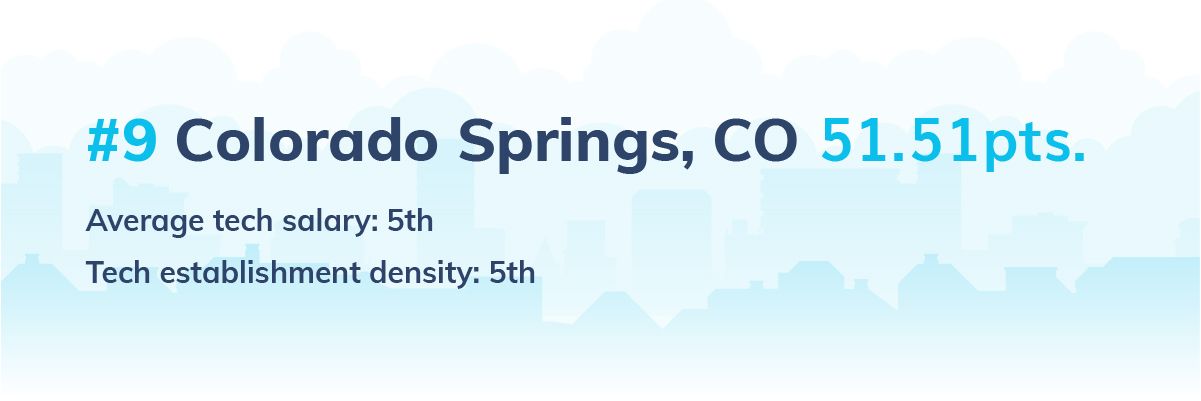
Colorado Springs’ average tech salary contributed 11.20 points to the metro area’s 51.51-point total. More precisely, the $91,859 annual income was the fifth-highest on the list — roughly $10,000 behind the average tech salary in second place. Colorado Springs also had the second-largest gap between the average salary and the average tech salary, with the latter being approximately 63.87% higher. There were also 94.7 tech establishments per 100,000 residents, the fifth-best on the list in terms of business density.
Notably, Colorado Springs gathered a modest 14.92 points out of 25 for its life quality index, given its 5.44% unemployment rate — the highest among the top 15 metro areas — and its below-average regional price parity. Health coverage was another indicator that Colorado Springs would need to improve to boost its score, as it sat at the bottom of the list at 49.6% — almost seven percentage points below Bridgeport-Stamford-Norwalk, Conn.
Are you a tech entrepreneur looking to start a business in a new location? Find your ideal coworking space in Colorado Springs, on CommercialCafe.com!
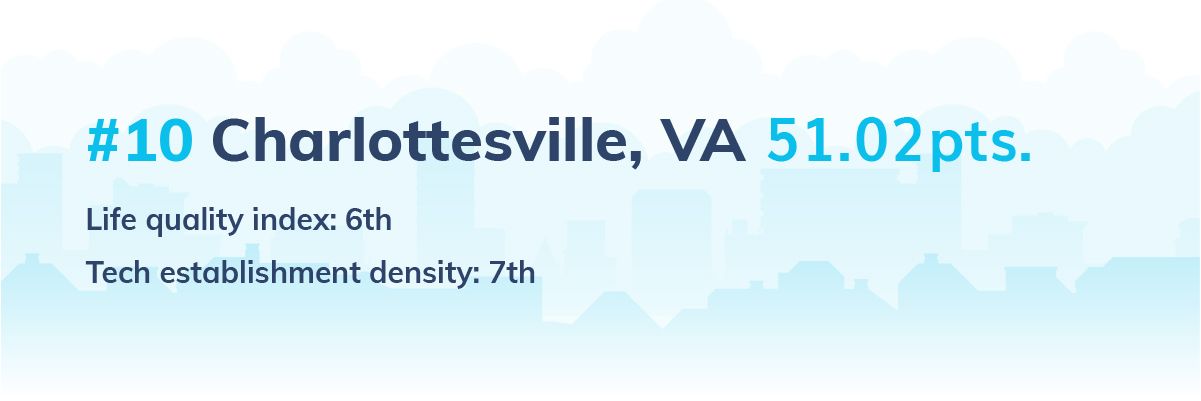
Charlottesville totaled 51.02 points. While that score only earned it the 10th spot on the list, the Virginia metro area has a lot to offer to incoming talent — from varied recreational activities, to wine and beer tours, to a vibrant indie music scene. In fact, there were 246.8 leisure establishments per 100,000 residents in Charlottesville in 2019.
The Charlottesville metro also garnered 17.47 out of 25 points for its life quality index performances. Here, roughly 49.24% of residents had a bachelor’s degree or higher, ranking the area third behind Boulder, Colo., and Ann Arbor, Mich. The unemployment rate was 3.5%.
Finally, tech salaries averaged $88,164 per year and there were 93 companies within that industry for every 100,000 residents. As such, Charlottesville ranked seventh for both indicators.
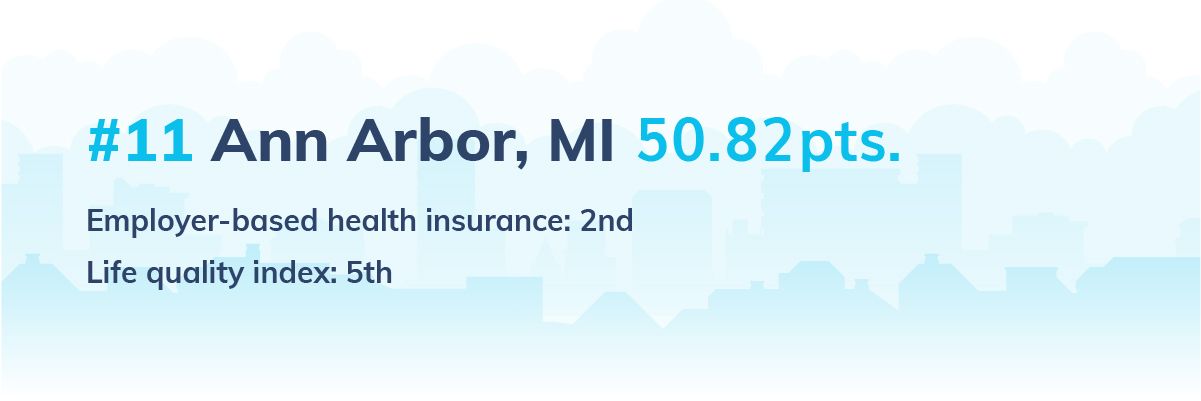
Ann Arbor, Mich., totaled 50.82 points, with health coverage as its top-performing metric. As a result, its placement as the runner-up earned it 4.81 out of 5 points. The metro also scored 18.07 out of 25 points on its life quality index, placing second for educational attainment levels (55.86%) and fifth in terms of the unemployment rate (3.04%, squeezed between Portland, Maine, and Provo, Utah).
However, tech professionals in Ann Arbor had the lowest average wage among the top 15 metro areas — $77,966 per year — but, they also had the highest density of tech businesses of the six Midwestern entries.
Are you a tech entrepreneur looking to start a business in a new location? Find your ideal coworking space in Ann Arbor, on CommercialCafe.com!
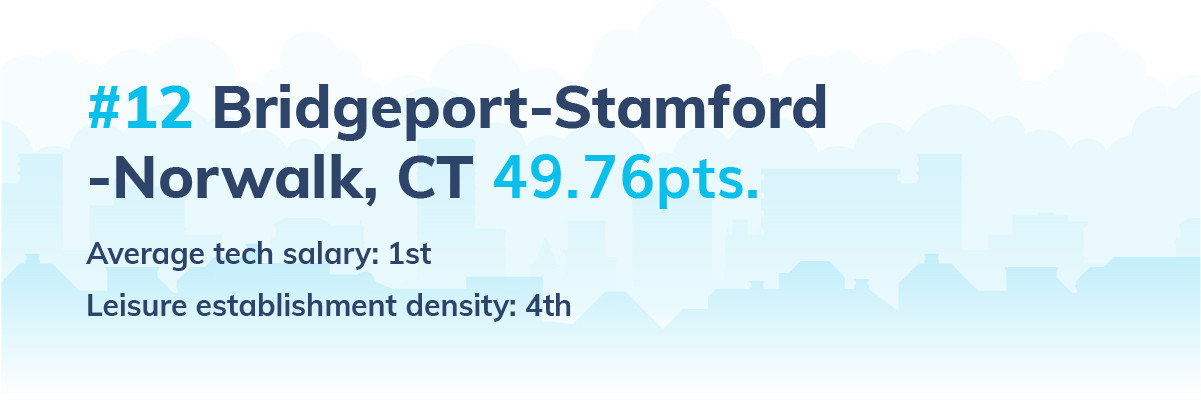
Roughly 19 of Bridgeport’s 49.76 points came from its great performances as far as its average annual tech salary and leisure establishment density, where it ranked first and fourth, respectively. In particular, the average yearly tech salary in Bridgeport was $106,591 — a nearly $30,000 gap between the highest and lowest ranking entries for this metric. There were also 87.8 tech companies per 100,000 residents here, as well as 33.9 occupations that fell under the tech category for every 1,000 jobs — the lowest density on the list.
Meanwhile, Bridgeport also had the fourth-highest educational attainment rate at 49.07%. And, when it came to entertainment opportunities, Bridgeport ranked fourth, with 271.4 establishments per 100,000 residents.
Are you a tech entrepreneur looking to start a business in a new location? Find your ideal coworking space in Stamford or Norwalk, on CommercialCafe.com!
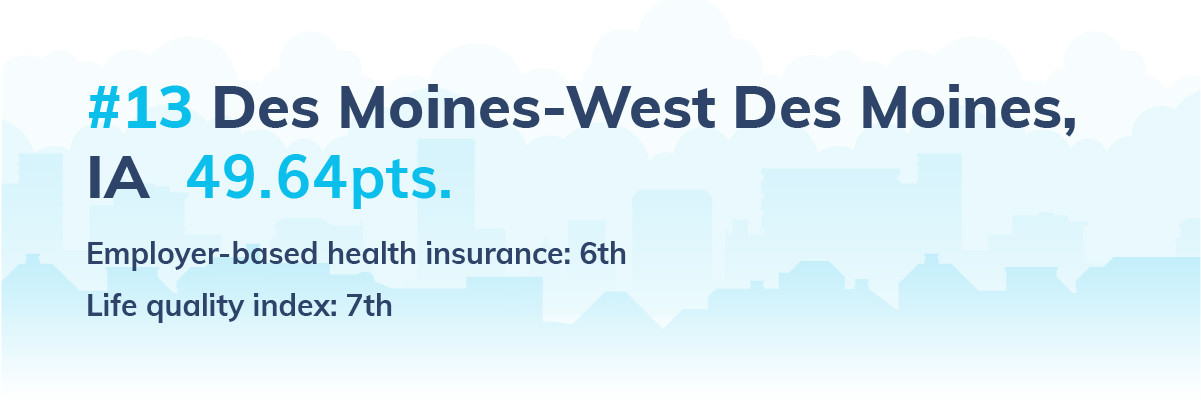
Des Moines received 13.12 out of 30 points for the number of tech occupations per 1,000 jobs. The average wage for workers in tech occupations here was also $82,439 per year — nearly 53% higher than the metro’s mean annual salary.
And, with 64.7% of workers covered by employer-based health insurance, Des Moines was sixth in line for this indicator – its best performance overall. Likewise, on its life quality index, the metro earned the seventh spot, boasting the third-best regional price parity.
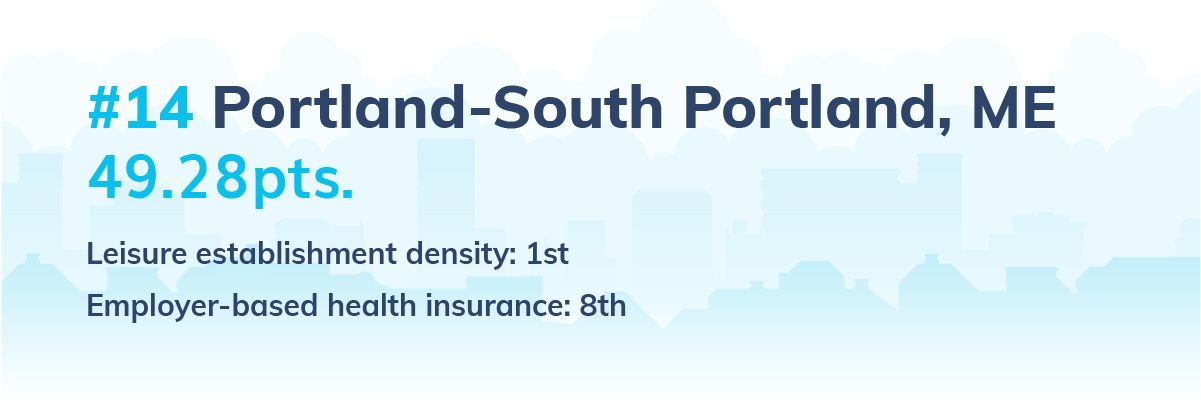
There were 333 leisure establishments per 100,000 residents in Portland-South Portland, Maine – the most of any of the 15 metropolitan areas that made the list. Plus, employer-based health insurance covered 63.4% of residents and the average tech income was around $84,073 per year.
Portland also picked up 16.1 out of 25 points for its life quality index with a 2.99% unemployment rate — placing fourth for this metric. In terms of the number of tech ventures per 100,000 residents, Portland landed on the lower half of the scale: This indicator contributed 3.94 out of 15 points to the metro area’s final score.
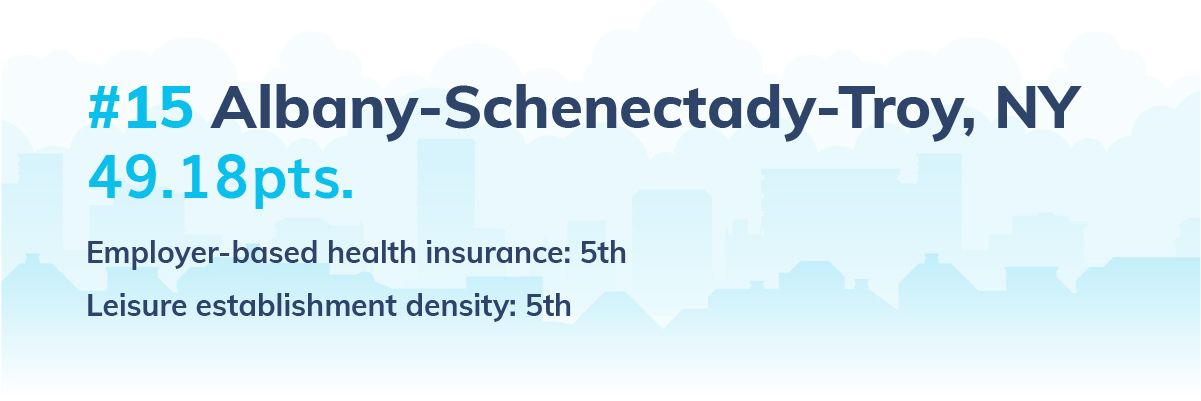
Albany closed out the list with 49.18 points, thanks to its most notable performances across the health insurance coverage and density of leisure establishments indicators. Here, the population was 67.2% insured and there were 260.1 leisure companies per 100,000 residents.
The average wage for a tech employee was $85,101 per year — nearly 44% more than the mean metro-level salary. Tech job density was also below the top 15 average, with 40.3 tech positions per every 1,000 openings.
Methodology
The study looked at U.S. metropolitan areas with a population of less than 1 million, according to the 2019 American Community Survey conducted by the U.S. Census Bureau.
Points for all indicators were distributed directly proportional to their value. Entries could gather a maximum of 100 points.
“Tech jobs per 1,000 jobs” referred to the number of tech positions per 1,000 jobs within each metropolitan area. This included occupational codes: 11-3021, 15-1211, 15-1212, 15-1221, 15-1231, 15-1232, 15-1241, 15-1244, 15-1245, 15-1251, 15-1256, 15-1257, 15-1299, 27-1024, 27-4032 (see below). Values scored were based off 2019 BLS Occupational Employment and Wage Statistics numbers. The maximum weight for this metric was 30 points.
“Average tech salary” calculated the average yearly salary across the following NAICS occupational codes: 11-3021, 15-1211, 15-1212, 15-1221, 15-1231, 15-1232, 15-1241, 15-1244, 15-1245, 15-1251, 15-1256, 15-1257, 15-1299, 27-1024, 27-4032. Values scored were based off 2019 BLS Occupational Employment and Wage Statistics numbers. The maximum weight for this metric was 15 points.
“Population % with employer-based health insurance” measured the percentage of the metropolitan area’s population older than the age of 16 that was covered by an employment-based health insurance plan. The metric referred to all employer-based health coverage, not just those offered by tech employers. Values scored were based off 2019 American Community Survey percentages. The maximum weight for this metric was 5 points.
“Tech establishments per 100,000 residents” included businesses registered with the NAICS code category of 5112, 5182, 5414, 5415 (see below). Values scored were based off 2019 U.S. Census County Business Patterns numbers. The maximum weight for this metric was 15 points.
“Leisure establishments per 100,000 residents” included art, entertainment and recreation establishments recorded under the following NAICS code categories: 7111, 7112, 7121, 7131, 7139, as well as food service and bars with alcoholic and non-alcoholic beverage bars, labeled: 7224, 7225 (see below). Values scored were based off 2019 U.S. Census County Business Patterns numbers. The maximum weight for this metric was 10 points.
The life quality index was a compound metric that included points gained for regional price parity, unemployment rate and educational attainment. The maximum weight for this metric was 25 points, distributed as follows:
- “Regional price parity” (RPP) measured the cost of living in a region by comparing it to a national average, conventionally set at 100. Areas with high/low RPPs typically corresponded to regions with high/low price levels for rents. In addition to housing costs, RPPs also covered all consumption goods and services. Values scored were taken from 2019 Bureau of Economic Analysis Points were awarded indirectly proportional. The maximum weight for this metric was 10 points.
- “Education” was the percentage of individuals 25 years or older who had a bachelor’s degree. Values scored were 2019 American Community SurveyPoints were awarded directly proportional. The maximum weight for this metric was 5 points.
- “Unemployment rate” highlighted civilian labor force and unemployment by state and metropolitan area. Values scored were 2019 American Community SurveyPoints were awarded indirectly proportional. The maximum weight for this metric was 10 points.
NAICS occupation codes and titles used to define tech employment:
“11-3021 Computer and Information Systems Managers”
“15-1211 Computer Systems Analysts”
“15-1212 Information Security Analysts”
“15-1221 Computer and Information Research Scientists”
“15-1231 Computer Network Support Specialists”
“15-1232 Computer User Support Specialists”
“15-1241 Computer Network Architects”
“15-1244 Network and Computer Systems Administrators”
“15-1245 Database Administrators and Architects”
“15-1251 Computer Programmers”
“15-1256 Software Developers and Software Quality Assurance Analysts and Testers”
“15-1257 Web Developers and Digital Interface Designers”
“15-1299 Computer Occupations, All Other”
“27-1024 Graphic Designers”
‘27-4032 Film and Video Editors”
NAICS codes and titles used to define tech establishments
“5112//”,“Software Publishers”
“5182//”,“Data Processing, Hosting and Related Services”
“5414//”,“Specialized Design Services”
“5415//”,“Computer Systems Design and Related Services”
NAICS codes and titles used to define leisure establishments
“7111//”,“Performing Arts Companies”
“7112//”,“Spectator Sports”
“7121//”,“Museums, Historical Sites and Similar Institutions”
“7131//”,“Amusement Parks and Arcades”
“7139//”,“Other Amusement and Recreation Industries”
“7224//”,“Drinking Places (Alcoholic Beverages)”
“7225//”,“Restaurants and Other Eating Places”


