
The U.S. office sector continues to be transformed at the confluence of industry uncertainties; elevated interest rates and challenging inflation; paradigm shifts in occupancy; the emergence of fast-evolving technologies that seem to be reaching every aspect of our lives; and sustainability considerations as to how and where we build.
Accordingly, confidence remains cautious regarding the outlook for 2025 as both domestic and global developments can sway direction. That said, for this ranking report, we looked at how the 100 largest office markets in the country fared through the final quarter of 2024 and then compared their performances in terms of fundamentals — including asking rent, vacancy, market expansion and loan maturities — to score how each of them stepped into the new year.
In order to keep up with evolution in the industry, we capture key performance trends across the 100 largest office markets in the U.S. in a series of quarterly ranking reports that compare and score markets across several metric categories, including vacancy, pipeline, asking rates, evolution of the coworking space segment, upcoming loan maturities, and quarterly shifts in online searches for both traditional and flexible office space.
See the methodology section for details and read on for highlights of the best-scoring markets, followed by a breakdown of the ranking report by metric category.
“As some underlying 2024 challenges roll over into 2025, we see a variety of possible solutions and outcomes going forward, depending on the combination of advantages at individual asset level. Some may be successful in obtaining new debt, others might make attractive investment opportunities for repositioning to coworking or different office use, while others still might end up being fully converted to non-office use (data center, industrial or residential) or decommissioned altogether.”
Peter Kolaczynski, Director, CommercialEdge
Key Takeaways
Top 10 Office Markets in Q3
- California and the East Coast yield six of the 10 best-scoring large office markets in Q4 2024 with Boston and San Diego in the lead.
- More than half of the best-ranking mid-sized office markets in Q4 hail from the Southern U.S., including three from Florida alone.
Top Scores for Each Ranking Metric Category (jump to section)
- Vacancy: Though some markets experienced modest relief in vacancy in Q4, 63% of locations included in the ranking continued to see vacancy rates creeping up.
- Asking rent: Nearly half of the markets we compared recorded an increase in the average asking rent from Q4 2023.
- Office construction: Both Q4 deliveries and projects still in development made for modest market expansion in terms of percentage of stock.
- Coworking space: More than 40 of the markets we analyzed recorded quarter-over-quarter growth in their local coworking scenes, both in terms of square footage added and the share of coworking out of the total local office space inventory.
- Loan maturities: Nearly 82% of loans maturing in 2025 across ranking report entries are concentrated in the 22 markets with more than 100 million square feet in this ranking.
- Search trends: Year-over-year online search trends show consistent and increasing interest in both coworking and office space at the close of the year.
Top 10 Office Markets Larger Than 100M Square Feet
Boston claimed the highest score in the large markets ranking (73 points out of 100) after earning notable performances across several of the metrics we compared. For instance, in Q4 2024, the Massachusetts powerhouse bagged the top score for the year-over-year increase in average asking rate for office space. It also wrapped up the quarter with the third-most office space under construction and closed the year with the fourth-lowest vacancy rate among the larger markets in our ranking.
Next, San Diego was the second best-scoring entry in Q4 2024 among the larger markets we analyzed, earning a total of nearly 72 points out of 100. The southern California market stood out for several of the metrics we compared, but largely owes its score to its Q4 performance in terms of vacancy (the city earned the top score for its percentage-point decrease from Q3), office development (with just 3% of stock under construction at the start of Q4), and the growth of the local coworking sector (the top score for the increase of coworking space as a percentage of the local office market).
Then, New Jersey ranked third among the larger markets in Q4 2024. At the end of the previous quarter, the state had added the most office space, both in terms of square footage and as a percentage of stock. At the same time, the market was second-best for its decrease in vacancy compared to Q3.

Not to be outdone, Minneapolis-St. Paul scored fourth-best among the larger markets in Q4 2024. The Twin Cities’ strongest suits were its comparatively low vacancy (the second-lowest among large markets at the close of the quarter) and the expansion of the local office market (it added the second-most square footage in Q4).
Meanwhile, as the second-best scoring of the three California office markets to make the top 10, Orange County rounded out our top five in Q4. Specifically, the OC claimed the second-best score for its comparatively low percentage of loans maturing in the market. It also saw the fifth-lowest vacancy rate at the close of Q4, as well as the sixth-largest 12-month increase in average asking rate for office space.
At the same time, Atlanta — which scored sixth-highest among the larger markets — claimed some of its most notable performances for metrics related to office market expansion, average office asking rent evolution, and online search volume trends. Of the larger markets analyzed in our ranking report, Georgia’s capital also added the third-most office space during Q4 and saw the fifth-largest 12-month increase in asking rents.
Manhattan, N.Y., earned the seventh-highest score among the larger markets. This ranking entry scored third-best for the comparatively low vacancy rate at the close of the year, in addition to seventh for its expansion of the coworking segment in Q4. Manhattan’s strongest suits in this ranking also included one of the 10 largest pipelines under construction as a percentage of stock.
Back out west, Los Angeles took eighth place in Q4. The southern California market earned its best score for vacancy. In fact, Los Angeles office space had the lowest vacancy among large markets at the close of the quarter.
Staying in the South, Dallas-Fort Worth was ninth among markets with more than 100 million square feet. It earned the second-best score for year-over-year average asking rent growth and scored among the 10 best for its percentage of stock that was under construction in Q4 2024.
Chicago wrapped up the top 10 by earning its best scores for metrics pertaining to the local coworking scene. The most populous city in the Midwestern United States added the second-most coworking space during Q4 and saw the fourth-largest increase of the share of coworking space out of total office space in the market.
Top 10 Office Markets Smaller Than 100M Square Feet
With a total score of 65 points out of 100, Miami ranked first among office markets with less than 100 million square feet in the fourth quarter. The favorite Florida destination boasted a noteworthy development pipeline to earn the top score in this group of markets for the percentage of office stock under construction at the start of Q4.
Across the country, Inland Empire, Calif., took second place in this ranking group. The southern California office market boasted the lowest vacancy among smaller entries at the end of 2024 with values continuing a virtually flat trend from the previous quarter.
Back on the East Coast, Richmond-Tidewater in Virginia earned the third-best score among the mid-sized entries in our ranking. The market’s best-performing metric pertained to the growth of the local office segment. More precisely, Richmond-Tidewater added the sixth-most office square footage during Q4 and also ranked sixth-best for the percentage of stock that was under construction at the start of the quarter.
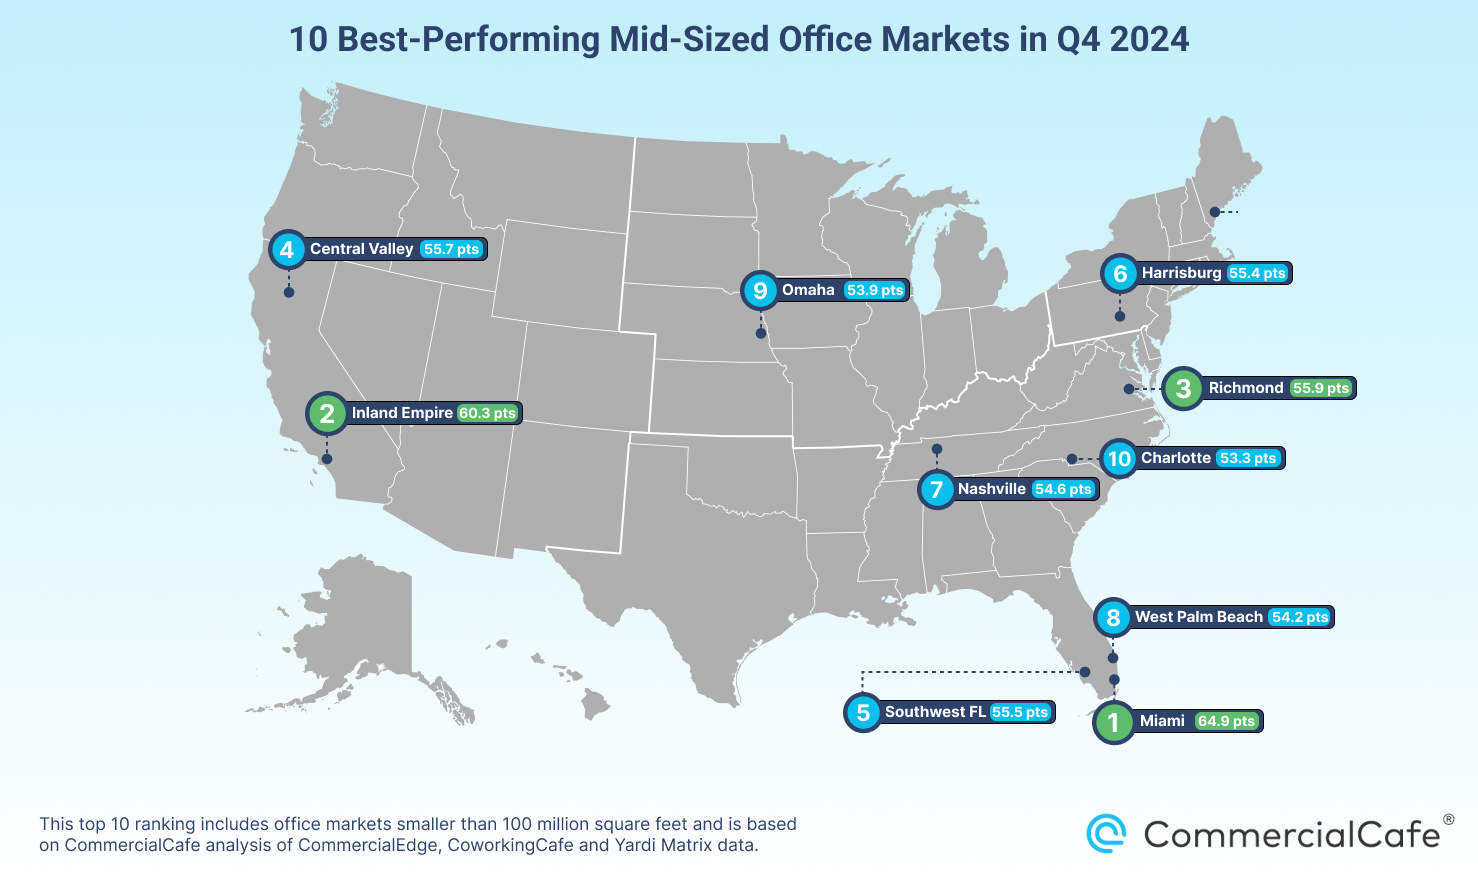
Next, the Central Valley in California placed fourth in the ranking among markets with less than 100 million feet, primarily due to its performance across pipeline and vacancy metrics. Within this group, the Central Valley added the third-most office square footage during the previous quarter, which earned it the second-best score for the percentage of office stock delivered in Q4. At the close of the quarter, the six-county market also had the fifth-lowest office vacancy rate among ranking entries with less than 100 million square feet.
Then, the Southwest Florida Coast market rounded out the top five in Q4. Its strongest suit was office vacancy with the second-lowest rate in this group at the close of the quarter. The market also scored among the 20 best entries for expansion of the office market compared to Q3 in terms of both square footage added in Q4 and the percentage of office stock it represented.
Up north, Harrisburg, Pa., placed sixth, mostly on the shoulders of its performance in terms of the expansion of the local office and coworking scenes: The Pennsylvania market received the sixth-highest score for coworking space added during Q4. This, in turn, represented the second-largest increase of the share of coworking out of the total local office space among mid-sized entries in the ranking. What’s more, Harrisburg office space added during that same time also placed the city fourth for market expansion as a percentage of stock.
Likewise, Nashville — which landed seventh in this ranking group — performed similarly to Harrisburg in that it also earned its best scores for the expansion of the local office and coworking segments. Specifically, Nashville finished third for the percentage of office stock that was under construction at the start of the quarter. Additionally, coworking space added here during that same time period earned the fourth-best score and represented the 11th-largest increase of the share of coworking out of the total local office space inventory in Q4 compared to other mid-sized markets in the ranking.
Back in Florida, West Palm Beach-Boca Raton was the eighth-best scoring market in Q4 among entries with less than 100 million square feet of office space. Here, the office vacancy rate was the third-lowest in the group, and the under-construction pipeline at the start of the quarter earned the eighth-best score for percentage of office stock in development.
Next, Omaha, Neb., placed ninth in the ranking among markets with less than 100 million feet. The most populous city in Nebraska earned the second-best score in this group for the percentage of office stock that was under construction in Q4 2024. At the same time, existing Omaha office space recorded the sixth-lowest vacancy among the mid-sized markets included in this report.
Charlotte, N.C., wrapped up the top 10. North Carolina’s most populous city scored fifth-best among mid-sized markets for year-over-year evolution of the average office asking rent and seventh-best for the percentage of office stock that was under construction at the start of the quarter. It also ranked among the 20 best for coworking space added during Q4 within this ranking group.
Top-Scoring Office Markets for Each Ranking Metric
1. Top-Scoring Markets by Vacancy Rate at Close of Q4
Gateway markets traditionally concentrate a significantly higher density of office space and feel any shift in occupancy proportionally. Accordingly, across the top 10 entries with more than 100 million square feet, vacancy rates were well into the double digits (from 16% to 19.4%). For comparison, within the mid-sized markets group, there were only two top-10 entries with vacancy rates drifting to single-digit values. (Rates in the top 10 ranged from 7.3% to 14.1%).
Markets Larger Than 100M Square Feet: Los Angeles, Twin Cities & Manhattan Only Large Markets to See Vacancy Below 17% in Q4 2024
Los Angeles office space saw the lowest vacancy rate, which rested at 16% in December 2024, following a modest percentage-point dip from the previous quarter. The second-lowest vacancy was in Minneapolis-St. Paul, where 16.2% of office space was unfilled in December. Manhattan, N.Y., (#3) was the only other market with more than 100 million square feet to close out the year with a vacancy rate below 17%.
Markets Smaller Than 100M Square Feet: Vacancy Ticks Upward in Inland Empire & Southwest Florida Coast in Q4 2024, but Stays Below 10%
Although vacancy rates across the top 10 mid-sized office markets in Q4 were generally lower than the larger entries, values also rested in the double digits for the great majority of this group. In fact, the only two ranking entries to see less than 10% of office space unfilled in December 2024 were the Inland Empire, Calif., and southwest Florida Coast markets. Despite a slight uptick in vacancy compared to the previous quarter, they held their positions to rank first and second-best for this metric, respectively.
2. Top-Scoring Markets for Q-o-Q Percentage-Point Change in Vacancy Rate
There was little relief in terms of vacancy rates from the previous quarter in markets larger than 100 million square feet. As a matter of fact, the greatest single-market decrease since Q3 was just one percentage point.
Markets Larger Than 100M Square Feet: More Top-10 Entries See Vacancy Slip in Q4 Than in Q3 2024
Six of the 22 office markets in this report with more than 100 million square feet of office space experienced a drop in vacancy from the previous quarter. However modest, it’s worth noting that, among the 10 larger markets scoring best for quarter-over-quarter (Q-o-Q) change in vacancy, there were six entries that recorded a dip in the percentage of unfilled office space in Q4. That’s compared to only three in Q3 2024.
More precisely, San Diego earned the top score for changes in vacancy rate after recording a one-percentage-point slip since Q3. New Jersey followed in second place with a 0.8-percentage-point dip from 20.2% vacancy in September to 19.4% in December. Houston was a very close third, showing a 0.7-percentage-point slip from 25.2% to 24.5%.
Markets Smaller Than 100M Square Feet: Vacancy Rates Slip in 40% of Mid-Sized Markets in Q4
Among the 53 office markets with less than 100 million square feet included in this ranking report, 22 saw office vacancy rates decrease from Q3 to Q4 2024. Of these, Lexington, Ky., was the top-scoring market in this category with a vacancy rate drop of 4.7 percentage points from September to December 2024. Next, Grand Rapids, Mich., earned the second-highest score for this metric with office space here seeing a four-percentage-point decrease in office space vacancy during Q4. St. Louis earned the third-best score as office space vacancy slipped 3.5 percentage points compared to Q3 2024.
More than half (68%) of the 22 office markets with more than 100 million square feet included in our ranking report saw a positive 12-month difference in office asking rents during the previous quarter. Meanwhile, of the 53 office markets with less than 100 million square feet, the share of entries with flat or positive asking rent trends was 60%.
Markets Larger Than 100M Square Feet: Boston, DFW & San Francisco Lead for Asking Rent Growth in Q4
At the close of Q4, Boston had the highest 12-month asking rate hike among the larger markets included in our ranking report. Dallas-Fort Worth (DFW) followed in second place with asking rents in December 2024 averaging 16% higher than a year before. Not far behind, San Francisco landed in third. Average asking rents here were 14% higher than in Q4 2023. Then, ranking fourth for this metric, Austin, Texas, was the final market in the top 10 to see asking rates increase by more than 10% from September to December 2024.
Markets Smaller Than 100M Square Feet: Kansas City Office Asking Rents See Top-Scoring Boost in Q4
Kansas City, Mo., maintained its top position for this metric for a second consecutive quarter and earned the top score for the largest 12-month increase in asking rates at the close of Q4 2024. Notably, Orlando, Fla. — which earned the second-best score for this indicator — was the only other market in this group to see rents increase more than 17% from the previous year. Staying in the Sunshine State, Miami scored third in this respect, followed by Indianapolis in fourth and Charlotte, N.C., rounding out the best five in rent growth.
1. Largest Office Market Expansions in Q4 2024
Nearly 5 million square feet of new office space was delivered during Q4 2024 across the 22 large markets in our ranking. At the same time, roughly 45% of the 53 mid-sized markets compared in this report also expanded their office stock, collectively adding roughly 3.7 million square feet.
Markets Larger Than 100M Square Feet: Boston Claims Top Pipeline Score With 13M Square Feet Added in Q3
Markets in this group showed a slowdown in completions and deliveries compared to the previous quarter: According to data on recently completed projects, only seven of the larger markets in our ranking added office square footage during Q4 2024, and none of them saw the office market expand by more than 1% of stock between September and December. New Jersey got the top score for adding the most office square footage during Q4 (a little more than 1.7 million square feet), but this total represented just 0.74% of stock.
Minneapolis-St. Paul received the second-best score for office square footage completed from October to December (744,000 square feet), while San Diego landed second-best for market expansion as a percentage of stock (0.52%).
Markets Smaller Than 100M Square Feet: Development Inches Ahead in Mid-Sized Markets at Slow End of Year
When looking at new office space delivered across smaller markets in Q4, the Cleveland-Akron market in Ohio got the top score for its nearly 610,000 square feet of office space completed during the last three months of the year. San Antonio followed in second place and was the only other mid-sized market included in the report where more than 500,000 square feet of office space was delivered in Q4.
Meanwhile, in California, the Central Valley added roughly 360,000 square feet of new office space, which was the third-most among this group of markets last quarter. Although this expansion represented a little more than 1% of stock, it nevertheless made the Central Valley one of only two markets to surpass the 1% mark in this respect in Q4. Grand Rapids, Mich., was the one other ranking entry to do so.
2. Largest Office Space Pipeline Under Construction in Q4 2024
Looking at the development pipeline of projects under construction at the end of Q4, we see nearly 60 million square feet of new office space was underway across the 22 large markets we compared. At the same time, a little more than 22 million square feet was in development across 41 of the 53 mid-sized markets ranked in this report. Considering the under-construction pipeline as a percentage of stock, data showed that none of the markets included were looking at a market expansion larger than 4% at the start of 2025.
Office Space Under Construction in Q4 as a Percentage of Stock in Markets Larger Than 100M Square Feet
The largest percentage of stock that was under construction at the start of this year was in Austin, Texas, which earned the highest score for this metric with nearly 4% of stock in various stages of development. San Diego was second with roughly 3% of stock under construction, while office projects in progress in Boston added up to about 2.9% of stock, which ranked the Massachusetts market a close third on this list.
Office Space Under Construction in Q4 as a Percentage of Stock in Markets Smaller Than 100M Square Feet
Miami led the under-construction pipeline ranking of office markets with less than 100 million square feet. Projects under construction here at the start of 2025 represented roughly 3.5% of stock. Then, the Midwest’s Omaha, Neb., earned the second-best score with a development pipeline representing 3.46% of stock. It was followed by Nashville, Tenn., in third place (3.3% of stock in progress at the start of 2025).
Of the 22 office markets with more than 100 million square feet included in this ranking report, 15 saw an increase in coworking space during Q4 2024. Otherwise, among the 53 markets with less than 100 million square feet we compared, 27 saw a positive difference in total coworking square footage from the previous quarter.
Markets Larger Than 100M Square Feet: San Diego Adds Most Square Footage & Has Largest Percentage-Point Market Expansion
San Diego added the most coworking space and received the highest score for its coworking expansion of roughly 318,300 square feet. In terms of the share of coworking space out of the local office market, this represented a modest increase of 0.313 percentage points from 2.08% in Q3 to 2.39% in Q4.
Chicago earned the second-best score for coworking space added during Q4 and was the second of three office markets to add more than 200,000 square feet of coworking space between October and December last year (the third was Phoenix). The Illinois market earned the fourth-highest score for the increase in the share of coworking space out of the total local office inventory (2.025% in Q3 to 2.118% in Q4).
Markets Smaller Than 100M Square Feet: Share of Coworking Space in Local Office Market Grows Slowly, but Surely Across Top 10
The Cleveland-Akron market in Ohio led for both square footage added and for expansion of the coworking segment as a share of the total local office space. Salt Lake City received the second-highest score for coworking growth in terms of square footage and placed fifth for the increase of the share of coworking space out of local office.
S&P Global analysis estimated that about 10% of the $950 billion of commercial real estate (CRE) mortgage loans maturing in 2024 were tied to office properties. Although that represented a larger proportion than in 2023, the ratio was expected to decline in 2025 and in subsequent years, even as the amount of CRE mortgage loans maturing yearly is expected to increase to a 2027 peak of nearly $1.3 trillion.
However, the numbers may still change going forward. That’s because lenders have been allowed by bank regulators to work with borrowers, rather than force loan maturities. This translates to CRE loans being extended from one year through the next and beyond.
Markets Larger Than 100M Square Feet: Detroit, Orange County & New Jersey Kick Off 2025 With Lowest Percentages of Loans Maturing
Detroit earned the highest score for this metric among office markets with more than 100 million square feet. In Motor City, loans due to mature represented a little more than 6% of the total future maturity value at the start of the year.
The next two best-scoring markets were also looking at less than 7% of future loan maturities coming due in 2025: Orange County, Calif., received the second-best score (6.67% of loans maturing) and New Jersey came in third (6.73%).
At the same time, Manhattan, N.Y., continued to rank among the markets with the lowest percentage of maturities (placing seventh with 9.3%), despite having the largest dollar value of loans maturing this year (nearly $24 billion).
At the other end of the loan maturities scoring scale, loans reaching maturity in 2025 in Atlanta accounted for nearly 21% of total loans — the highest percentage among office markets with more than 100 million square feet.
Top-Scoring Markets for Online Office Space Searches
In Q4 2024, only three of the 22 office markets with more than 100 million square feet included in this ranking saw a year-over-year increase in the average monthly volume of searches for office space. In this case, Atlanta earned the top score for its 18% boost in search volume compared to the monthly average in Q4 2023. Dallas-Fort Worth followed in second place with an increase of 13%, and New Jersey office space wrapped up the top three with a modest 3% increase in the average monthly search volume compared to 12 months prior.
Top-Scoring Markets for Online Coworking Space Searches
Seven of the 10 best-scoring large markets in the ranking saw a positive year-over-year difference in average monthly volume of online searches for coworking space. Moreover, in San Diego, Atlanta and San Francisco, the increase was 20% or larger from the average search volume in Q4 2023.
Meanwhile, the average monthly search volume for coworking space in markets with less than 100 million square feet increased for nine of the entries in our ranking. However, as is often the case with comparatively smaller coworking scenes, a large difference in percentage can be due to a relatively small difference in numbers. For instance, Fort Wayne, Ind., soared to the best score for a 600% year-over-year increase in average monthly search volume, which went from 30 in Q4 2023 to 210 in Q4 2024.
Methodology
For this ranking, we compared the 100 largest office markets in the U.S. (by total office space square footage) across several indicators — office space lease rate, vacancy, the local coworking segment, pipeline activity, loan maturities, and online search interest for each location on the list. All individual ranking metrics are explained further below.
We based our analysis on commercial real estate data and research from CommercialEdge, CoworkingCafe, and Yardi Matrix, as well as analysis of Google search trends. For a fairer comparison, we divided the dataset into two groups and chose the cutoff threshold to be at 100 million square feet. Each group was then comparatively ranked separately. Furthermore, to account for the occasional percentage-value volatility in markets with low leasing activity, the final rankings include only those markets where the average asking lease rate was calculated based on at least 100 listings.
A certain number of maximum points was attributed to each metric. This total was evenly distributed between the lowest and the highest metric values in each of the two groups. On this scale, a score was calculated for each location based on its metric values. The factors (metrics or indicators) on which we based the composite scores are explained below.
For average vacancy rate and loan maturity rate, the number of points awarded was inversely proportional to the metric values. For all other indicators, the number of points awarded was directly proportional to the metric values.
- Refers to the year-over-year comparison between asking lease rates in each office market between the last month of Q4 2023 and the last month of Q4 2024. This metric reflects the percentage change in asking rate during that 12-month time period.
- Maximum points: 20
- Data source: CommercialEdge
- In this category, we looked at two aspects:
- the vacancy rate for each market in the last month of Q3 2024 (a metric for which we attributed a maximum of 25 points)
- the percentage point change in vacancy rate compared to the last month of Q2 2024 (for which we attributed a maximum of 5 points)
- Maximum points: 30
- Data source: CommercialEdge
- This metric category included three indicators:
- office square footage added during Q3 in each of the locations we included in the ranking (maximum 10 points)
- office space added as percentage of total inventory between June 2024 and September 2024 (maximum 5 points)
- office space under construction at the start of Q4 as a percentage of total market inventory (maximum 10 points)
- Maximum points: 25
- Data source: CommercialEdge and Yardi Matrix
- In this category, we looked at two aspects:
- the change in total coworking space square footage for each market compared to the previous quarter (a metric for which we attributed a maximum of 2.5 points)
- the percentage point change of the coworking share out of total office space in each location compared to the previous quarter (maximum 2.5 points).
- Maximum points: 5
- Data source: CoworkingCafe
- This metric refers to the total of loans that are due to mature in 2024 as a percentage of total loans in the market.
- Maximum points: 10
- Data source: CommercialEdge
- As a potential indicator of tenant interest in the market, we looked at changes in the monthly average volume of online searches for both office and coworking space compared to the monthly average at the same time in the previous year. We attributed a maximum of 5 points for each property type.
- Maximum points: 10
- Data source: in-house analysis of Google searches for office- and coworking-related keywords

