Key takeaways:
- Total sales volume in NYC topped $21B in 2016
- The average price per sq. ft. in Manhattan reached a 5-year peak ($1,347)
- June proved busiest month of the year—transaction volume reached $4.4B
- NYC commercial market attracted record foreign capital in 2016
- Largest sale of the year: AXA Equitable Center at 787 7th Ave. traded for $1.9B
- One Brooklyn sale among largest transactions of 2016–Watchtower Building Sold for $340M
- What’s next? Major office projects in the works in NYC
It was the best of times, it was the worst of times — a fitting description for the New York City office market in 2016. Though leasing activity in Manhattan dropped significantly in the midst of political and economic uncertainty, according to data from JLL, this did not put a damper on office sales in NYC. Though activity cooled down from the highs of 2015, investment sales volume remained strong in 2016, surpassing the levels of 2012-2014.
Our study analyzed commercial office transactions of more than $5 million and office buildings and spaces of over 5,000 square feet, from 2012 to 2016, based on Yardi Matrix and PropertyShark sales and proprietary research. The sales included were recorded up until Jan. 25, 2017, and we excluded ownership stake transactions.
Investor Appetite Still High—Sales Volume Tops $21B in 2016
128 office buildings changed hands in 2016 for a total of $21.1 billion — a downtick of 7% year-over-year in sales volume. And though the number of transactions dropped below the level of the previous two years, the overall sales volume in NYC remained above the previous 4-years average — and more than twice the number recorded in 2012. More than 22 million square feet of New York office space traded in 2016, a 3% drop year-over-year. Investors were not deterred by last year’s political volatility, and 2016 turned out to be a very fruitful year for NYC in terms of office sales activity.
Price per Square Foot Continues Upward Trend in Manhattan, Reaches 5-Year Peak
Spurred on by strong demand for high-quality office space and healthy market fundamentals, the average price per square foot for an office building in Manhattan has been steadily climbing over the past 4 years. The average price reached $1,347 per square foot in 2016, a 7% uptick year-over-year and 40% higher than the price recorded in 2012. Midtown Manhattan boasts the highest price per square foot in the borough—54 office assets traded at an average of $1,531 per square foot, a 28% increase year-over-year. By comparison, the average price per square foot of office space in Downtown Manhattan decreased 32% in 2016, resting at $935 per square foot–$441 shy of the average recorded in 2015.
Though it’s no surprise that Manhattan remains the main target for office investment in New York City, other boroughs also managed to attract a good deal of capital in the past year. In Queens, 13 office properties changed hands in 2016 at an average price of $762 per square foot—a 28% increase year-over-year for office space in Queens. The average price per square foot in the borough rose 116% over the past 4 years, a sign that some investors are shifting their focus from over-priced Manhattan toward the outer boroughs.
By comparison, the price per square foot for office space in Brooklyn decreased 16% in 2016 to $690 on average, after peaking at $819 in 2015. Office sales activity cooled down in the borough last year, with 13 assets trading hands—down from the previous year’s total of 21.
Monthly Sales Volume Reaches $4.4B in June
Office investors started the year in full force, with over $2.3 billion worth of properties changing owners in January. However, June proved to be the busiest month for office investment in 2016—18 assets traded for a total of $4.4 billion. Two of the year’s biggest deals also closed in June—the $1.7 billion sale of 388-390 Greenwich St. and the $914 million sale of the remaining 49% stake in 1211 Avenue of the Americas. Incorporating roughly 765,200 square feet of TriBeCa office space, the transaction of the Greenwich Street property boils down to about $2,220 per square foot.
NYC Market Attracts Record Foreign Capital in 2016
2016 also marked a busy year for foreign investment in NYC, with over half of the 20 largest office sales of 2016 driven partially or exclusively by foreign capital. According to the Financial Times, quoting commerce ministry data, Chinese companies’ overseas purchases topped 2015’s record of $121 billion for non-financial outbound investments, reaching a total of $146 billion in the first 10 months of 2016.
China reached a record of $33 billion in overseas commercial and residential real estate investment in 2016–a nearly 53% increase year-over-year, according to JLL data. Investment in land, offices, and hotels accounted for 90% of all Chinese outbound capital in the past 3 years, while the hospitality and industrial sectors marked the largest increase in 2016.
The year also proved fruitful for AXA Financial, the American arm of Paris-based insurance firm AXA, which cashed in a total of $3.6 billion on the sales of 787 7th Ave. and 1285 Avenue of the Americas—two of the largest office deals to close in NYC in 2016.
Largest Office Sales of the Year — 787 Seventh Ave Commands $1.9B
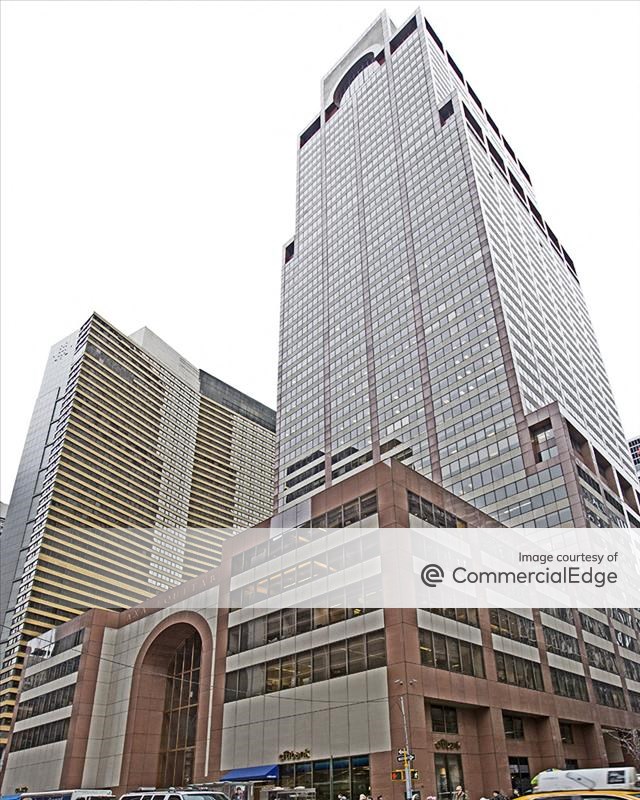
The year’s biggest office deal closed in January, when CalPERS shelled out in excess of $1.9 billion to acquire the AXA Equitable Center at 787 Seventh Ave., in Manhattan. Encompassing more than 1.6 million square feet of prime Plaza District office space, the sale closed at $1,179 per square foot, marking one of the largest investments in the pension fund’s history.
There were seven office sales that topped the $1 billion mark in 2016, and 12 that fetched a sale price exceeding $500 million. While 19 of the top 20 largest office deals of the year closed in Manhattan, one Brooklyn sale landed the 17th spot: the Jehovah’s Witnesses Watchtower Building sold for $340 million in August.
Manhattan office space remained the top choice for office investment in 2016 — 100 properties changed hands in the borough, out of a total of 128 sales overall. Nonetheless, the outer boroughs managed to draw in $769 million in investments, with 15 assets trading in Brooklyn and 13 assets in Queens.
| # | Sale price | Address | Borough | Buyer | Seller |
|---|---|---|---|---|---|
| 1 | $1,932,900,000 | 787 7th Avenue | Manhattan | CalPERS | AXA Real Estate |
| 2 | $1,767,913,114 | 388-390 Greenwich Street | Manhattan | Citigroup | SL Green Realty |
| 3 | $1,649,000,000 | 1285-1297 Avenue of the Americas | Manhattan | RXR Realty | AXA Real Estate |
| 4 | $1,400,000,000 | 550 Madison Avenue | Manhattan | The Olayan Group | The Chetrit Group |
| 5 | $1,152,970,000 | 1095 Avenue of the Americas | Manhattan | Hong Kong Monetary Authority | Ivanhoe Cambridge + Callahan Capital Partners |
| 6 | $1,150,000,000 | 63 & 200 Madison Avenue | Manhattan | Jamestown | George Comfort & Sons + Loeb Partners Realty |
| 7 | $1,030,000,000 | 1221 Avenue of the Americas | Manhattan | China Investment Corporation | Canada Pension Plan Investment Board |
| 8 | $913,623,081 | 1211 Avenue of the Americas | Manhattan | Ivanhoe Cambridge | Beacon Capital Partners |
| 9 | $700,000,000 | 1 New York Plaza | Manhattan | China Investment Corporation | Brookfield Properties |
| 10 | $565,000,000 | 1250 Broadway | Manhattan | Global Holdings | Jamestown |
| 11 | $561,000,000 | 7 West 34th Street | Manhattan | Korea Post | Vornado Realty Trust |
| 12 | $525,000,000 | 693 5th Avenue | Manhattan | Fimalac | Thor Equities |
| 13 | $480,000,000 | 11 Madison Avenue | Manhattan | PGIM Real Estate | SL Green Realty |
| 14 | $463,000,000 | 850 3rd Avenue | Manhattan | MHP Real Estate Services | Shorenstein |
| 15 | $453,000,000 | 885 3rd Avenue | Manhattan | Ceruzzi Properties + Shanghai Municipal Investment USA | SL Green Realty |
| 16 | $420,000,000 | 501 West 30th Street | Manhattan | Allianz Real Estate of America | Related Companies |
| 17 | $340,000,000 | 51 Furman Street | Brooklyn | Kushner Companies | Jehovah's Witnesses |
| 18 | $334,068,741 | 285 Madison Avenue | Manhattan | RFR Realty | GreenOak Real Estate + East End Capital + Downtown Properties |
| 19 | $330,000,000 | 433-447 9th Avenue | Manhattan | Cove Property Group | EmblemHealth |
| 20 | $280,000,000 | 1700 Broadway | Manhattan | Ruben Companies |
Fifth Avenue Sale Prices Top $5,000 per Square Foot

693-695 Fifth Avenue (via PropertyShark)
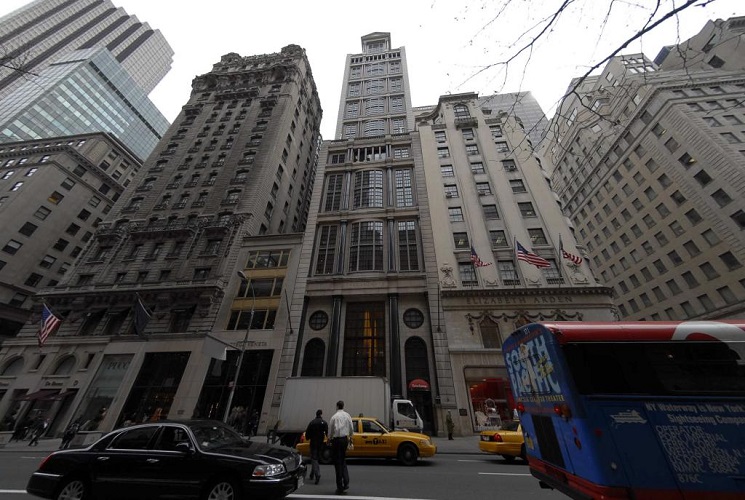
Thor Equities closed on a major deal in the summer, selling its Central Midtown office and retail asset at 693 Fifth Ave., for $525 million — nearly four times what it paid for the property back in 2010. The deal marked one of the highest per square foot prices of the year in the city: the 20-story building was acquired by French billionaire Marc Ladreit de Lacharrière, chair & CEO of holding company Fimalac, for $5,182 per square foot.

570-574 5th Avenue (via PropertyShark)
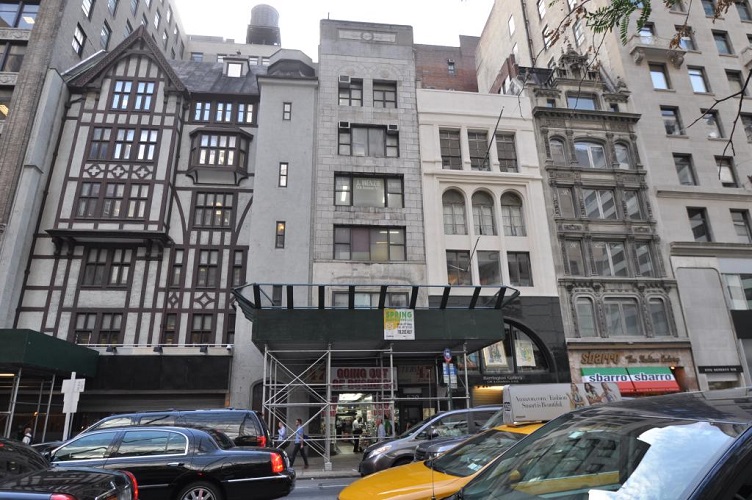
By comparison, the highest price recorded in 2015 was $5,155 per zoning square foot, also on Fifth Avenue — SL Green Realty sold 570 and 574 Fifth Ave., for a total of $125 million. The Central Midtown assets total 24,327 square feet and were acquired by Extell Development, which intends to demolish them to make way for a major development in Midtown’s Diamond District.
What’s Next? NYC Projects in the Works
Following the conclusion of the presidential election, New York City’s office market is picking up even more steam. Office leasing activity in Downtown Manhattan nearly tripled month-over-month in December 2016, totaling 256,000 square feet, and the average asking rent was $58.2 per square foot, up 3% from the previous year, according to CBRE. Midtown Manhattan recorded its third consecutive month of positive absorption, with monthly leasing activity totaling 1.37 million square feet — 6% above its 5-year monthly average of 1.29 million square feet. The average asking rent remained unchanged from the previous year, at $80.2 per square foot, as per CBRE data.
All signs are pointing toward another positive year for office activity in New York City in 2017, as companies continue to expand their footprint and demand for new, high-quality office space is intensifying. The market is expected to gain even more momentum over the following years, with a variety of major office projects already in the works. We’ve gathered some of the highlights below:
50 Hudson Yards
Scheduled to begin construction in 2017, the 58-story tower is designed to incorporate 2.8 million square feet of Chelsea office space and is part of the $20+ billion Hudson Yards redevelopment project undertaken by Related Companies and Oxford Properties Group. Designed by Foster + Partners, the building will take up an entire city block and be the fourth-tallest office building in the city upon completion in 2022.
3 World Trade Center
The 80-story tower developed by Silverstein Properties is part of the rebuilding of the World Trade Center site in Lower Manhattan. Adding 2.5 million square feet of Manhattan Financial District office space, the tower at 175 Greenwich St. topped out in 2016 and is scheduled for completion in 2018. 3 WTC will incorporate five floors of retail space and is expected to earn LEED Gold certification from the USGBC, according to data from Yardi Matrix.
One Vanderbilt
Construction on the 57-floor supertall structure began in 2016 on the corner of 42nd Street and Vanderbilt Avenue in Midtown Manhattan, adjacent to Grand Central Terminal. Developed by SL Green, the glass-clad, 1.7 million-square-foot tower is expected to become the city’s second-tallest building, upon completion in 2020, according to Dezeen.
30 Hudson Yards
The 90-story tower broke ground in December 2012, accounts for 2.6 million square feet of office space in Hudson Yards, and is slated to be the tallest structure within the multi-building development. Located in Chelsea, the Kohn Pedersen Fox-designed building is expected to achieve LEED Gold certification from the USGBC and be completed in 2019. Time Warner will reportedly relocate most of its offices to 30 Hudson Yards, taking over almost 40% of the building, according to The New York Times.
Methodology
- Property type: Commercial – Office (buildings and spaces)
- Period: January 2012 to December 2016
- Sale price per transaction > $5,000,000
- Sq. ft. > 5,000
- Average sales price included only for transactions with square footage, “ownership stake” transactions excluded
- Recorded until January 25th 2017
Want to see what other top office markets have to offer? Select any location from those linked below to check out the local listings!
Note: While we have made every attempt to ensure that the information included herein has been obtained from reliable sources, we are not responsible for any inaccuracies or omissions, or for the results obtained from the use of this information.


