Executive summary:
- Lease Prices in Trophy LA Properties Overtake Class A Prices
- Orange County Quarterly Office Sales Top $524M, a High for the Year
- A Total of 26 Office Projects are Set to Deliver More Than 2.2M Square Feet Across Both Markets
In Q3, the office markets of Los Angeles and Orange County fell to $1.19 billion in sales volume from more than $2.1 billion last quarter. Orange County registered a new five-year record high in average price per square foot, growing more than 7% over last quarter to $299. Los Angeles, however, reversed course and fell more than 15% quarter-over-quarter to $361, above 2018 prices, but still falling below the $400 mark for the first time in 2019.
Los Angeles’ sales volume decreased dramatically—almost 53% year-over-year—along with total traded square footage which fell 54%. While Orange County’s sales volume decreased by 40% year-over-year, it increased to more than 1.8 million square feet—more than 18% from last quarter—continuing its rebound from its Q1 low.
Los Angeles’ Sales Volume Drops 53% Y-o-Y to $665M
In Los Angeles, the transaction volume increased steadily this quarter with 22 sales, two more than last quarter. Just over 2.1 million square feet traded in Q3—a decrease both quarter-over-quarter and year-over-year of 34% and 54%, respectively. The average price per square foot fell below $400 for the first time this year to $361—decreasing more than 15% over last quarter, but still registering an increase of almost 13% over last year.
A hefty decrease in overall traded office square footage mixed with decreasing prices brought the total sales volume of the LA market to just over $665 million—representing a 60% drop over last quarter and 52% over last year. With volume and prices depressed in Q3, LA office market will look for volume to gain some traction going into year-end.
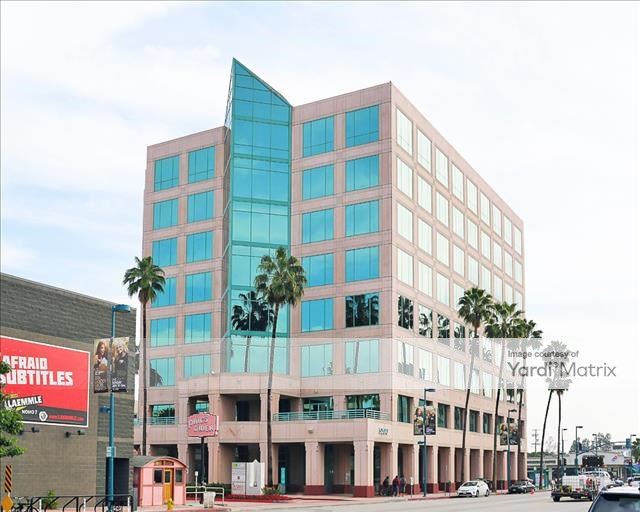
The largest office deal in LA was in August when a joint venture between Rockwood Capital and Artisan Realty Partners picked up The Academy Tower in the NoHo Arts District from Swift Real Estate Partners for $91.25 million—about $521 per-square-foot. Swift acquired the 175,000-square-foot office building in 2016 for $61.5 million and invested $2 million in renovations, which included a new lobby and façade. The deal was financed with an $89.4 million loan from Bank of America.
Healthcare Trust of America picked up the medical office building at 2100 West 3rd Street in the Westlake district for $85 million. The 140,000-square-foot property was sold by Stockdale Capital Partners, carrying a price-per-square-foot of $608. Formerly known as the St. Vincent’s Medical Office Building, the Class A property is under a 99-year ground lease held by Vincentian Health Services that will expire in 2085.
Lease Rates in Trophy Properties Surpass Class A Space
While the average lease rates by improvement class have stayed relatively flat over last year, the lease price per square foot in trophy properties surpassed the price for Class A properties in July and has maintained this position through September, climbing to $47.50 per-square-foot. Class A leases have been more expensive since January 2018. The Los Angeles office market vacancy holds firm at 12.7%, with more than 7 million square feet of dedicated coworking space—2.6% of total office space.
Orange County Sales Volume Continues Rebound, Surpassing $500M
In Q3, 1.8 million square feet traded in Orange County for a total of $524 million—an 18.5% increase in sales volume over last quarter. While this is the highest volume this year, it’s still 40% below last year’s $873-million high during the same quarter. Specifically, there were a total of 11 deals closed this quarter—five less than last quarter.
Still, the average price per square foot increased 3% year-over-year to $299. While not a large increase, this represents a return to the highs of the previous year—above $290—and steady quarter-over-quarter growth in 2019.
In August, Drawbridge Realty Trust acquired the Pacific Center in Santa Ana for $97.5 million in the largest deal of quarter. The two-property portfolio consists of 393,000 square feet; both properties were renovated in 2016 by the sellers, The Brookhollow Group and Pacific Coast Capital Partners, who upgraded both lobbies and outdoor spaces.
In a close second, Onni Group picked up Ocean Plaza in Huntington Beach for $97.3 million in July. The property has more than 205,000 square feet of Class A office space in addition to 117,000 square feet of retail and exhibition space. The seller, Decron Properties, recently completed renovations to the main lobby and modernized the elevators.
Occupancy in Orange County Steady at 88.3%, Lease Rates Flat
Vacancy rates in Orange County settled at 11.7% this quarter with lease rates relatively flat for all improvement classes. Almost 2.1 million square feet of dedicated coworking space occupies 1.9% of the total square feet of office space in the market.
Strong Completions Delivered in Q3, Trend to Continue in Q4
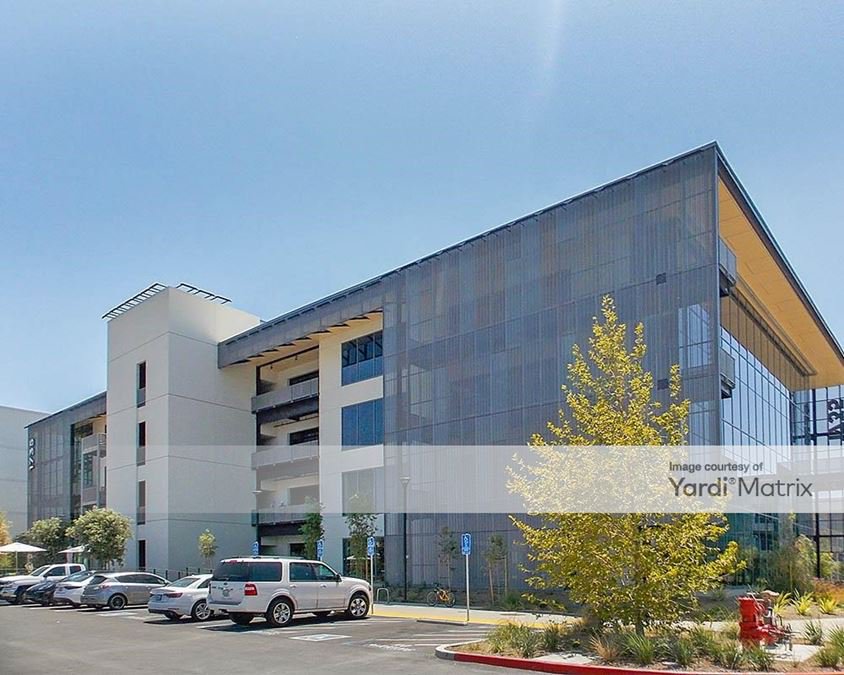
In Q3, the Los Angeles and Orange County markets delivered more than 2.2 million square feet of office space. The two Civic Center buildings that house City Hall and the Port Authority headquarters were completed in July, adding more than 500,000 square feet of Class A office space to Long Beach. Four buildings were also completed at FLIGHT at Tustin Legacy in Tustin, CA. Buildings A-1 and A-2, B, and C added 417,000 square feet of Class A creative office space.
Going forward, the Los Angeles and Orange County market pipelines for Q4 are projected to deliver about 2 million square feet of office space across 26 projects. Most of the completions will be in Los Angeles proper, with 12 projects set to deliver 821,875 square feet of office space. Other projects will also be completed in Culver City and Mission Viejo. The largest Q4 completion looks to be Phase I at 17111 Red Hill Avenue in Orange County, which is slated to total 245,300 square feet.
Methodology
For this report, we relied on Yardi Matrix data to analyze all office transactions to close in the Los Angeles and Orange County markets during the third quarter of 2019 (July through September). Only those carrying price tags equal to or larger than $5 million each were selected. Our research, based on sales data recorded through October 31, 2019, includes completed office buildings that are equal to or larger than 25,000 square feet.
Regarding mixed-use assets, only properties with more than 50% office space were considered. Portfolio deals were counted as single transactions, while distressed sales were excluded altogether. To ensure that the trends and comparisons presented in our report were valid, we also excluded “ownership stake,” “ground lease,” “controlling interest,” “portfolio” and “undisclosed” deals from our calculation of the average price per square foot.
Although we have made every effort to ensure the accuracy, timeliness and completeness of the information included in this report, the data is provided “as is” and neither CommercialCafe nor Yardi Matrix can guarantee that the information provided herein is exhaustive.
Property images courtesy of Yardi Matrix.


