
In her work, urban writer and activist Jane Jacobs emphasized the role of diversity in fostering thriving cities that provide exciting and stimulating environments for a wide range of people. Through her research, she argued that creating conditions for social and business diversity is particularly important at the very heart of the urban built environment — a city’s downtown or central business district (CBD). But, where does one begin a productive discussion on a topic as complex as diversity?
In her pragmatic way, Jacobs observed that cities that can provide businesses, non-profits, and/or creatives with access to buildings of varying sizes, ages, and rent prices are also more likely to attract a wide selection of companies and services. She reasoned that this then facilitates an environment that’s welcoming to various kinds of businesses, which also brings an increased variety of employment and talent recruitment opportunities.
Building upon this idea, our analysis relies on the Shannon Equitability Index (a commonly used formula in biodiversity studies) to determine how the CBDs of major U.S. cities ranked across three metrics that we determined to be vital for the richness and vibrancy of local economies. Namely, diversity and distribution of:
- Companies from various industry sectors
- Businesses by their number of employees
- Office spaces by class
For more information regarding data sources please consult our methodology. Keep reading to find out more about the reasons for our metric selection, as well as our research’s focus on CBDs within cities, or skip to our top 20 highlights.
Measuring Business Diversity
Why focus on CBDs?
Downtowns and central business districts are great places to study to get a sense of the prevailing trends and aspirations of a generation and to witness how changing economic or technological trends have an influence on the types of businesses that want and can afford to have a presence near the heart of a city.
For instance, from the 1980s up until the late 2000s, CBDs were notoriously unwelcoming sites on weekends or outside of working hours. That’s because people had little reason to stick around due to the area’s narrow focus on meeting the demands of office work, as well as the absence of any entertainment venues or leisure activities that could be pursued.
However, as Millennials entered the workforce, the zeitgeist shifted toward a revival of city centers as live/work/play communities buzzing with life at all hours, which brought about an increase in the diversity of economic activities conducted in these areas. Furthermore, the growth of a strong tech entrepreneurial culture and the need for flexible and affordable office spaces that could welcome smaller, more agile workforces revitalized older buildings across CBDs.
Note: While a city’s CBD may often be distinct from its downtown, the following analysis uses the terms interchangeably to prevent unnecessary repetition, but always referring to business districts.
How Industry Distribution is Key for Vitality of U.S. Downtowns
The distribution of companies across various industries is important to the resilience of the local economy because it leaves the area less dependent on the fortunes of one or a small number of sectors. Accordingly, the Shannon Equitability Index allows us to identify cities in which there are major tilts in favor of one or two particular business types within the CBD.
Why does employment size distribution matter?
Small, mid-sized and large employers all come with their own pros and cons, which is why having a good mix is a boon for any city’s central business district.
For instance, working for an established company that has a sizeable workforce usually means more structure and predictability for employees in terms of their mentoring, career path, working requirements and remuneration. These places also generally provide higher job security.
However, for people whose skills lean more toward independence and entrepreneurship, or those who simply work and communicate better in tightly knit groups, startups and firms that rely on a smaller team of dedicated professionals might be the best option. These places are also more likely to provide opportunities to young talent entering the labor market.
The Need for a Wide Range of Office Class Types in CBDs
In “The Death and Life of Great American Cities,” Jane Jacobs made an argument for the value of different-aged buildings within a city area, maintaining that it allows not just for a wider range of amenities, but also for more affordable rent prices.
However, because major renovations and conversions of older structures have become an important development trend — especially in primary real estate markets across the U.S. — we decided to look at office buildings by class instead of focusing on the year these structures were originally built. Looking at the make-up of available workspaces in downtowns by class is a more accurate and up-to-date reflection of the type of tenants that these properties are able to attract, as well as the rent prices they can charge.
Defining the Shannon Equitability Index & Its Use in Measuring Diversity
Several formulas attempt to quantify diversity within a given environment, each focusing on specific aspects. Naturally, they all come with inherent limitations, so it was important to select the most relevant one for the purposes of this particular analysis.
Broadly speaking, diversity indices measure two main features of a system — one of them relates to richness or the number of different items within (for example, how many buildings with different ratings there are in a CBD), while the other measures the relative abundance of the items present (such as whether Class A buildings dominate the CBD or if there’s a relatively even spread between all building types).
The Shannon Equitability Index measures the dominance or evenness of certain items — in our case, the number of businesses across various industries, different categories of employment by size and the number of office spaces across all rating levels. This evenness scale ranges from 0 to 1 with higher numbers indicating higher levels of evenness. In contrast, lower values indicate that one or few business or building types dominate the community. Check out the equitability table in our methodology section for more information on the scores obtained by each of the top 20 entries across the three metrics.
Columbus, Ohio #1 for Most Diverse CBD Amid Southern Dominance of Top 20
The assessment of the most diverse U.S. CBDs according to our set of indicators produced a fittingly varied podium with Columbus, Ohio; Nashville, Tenn.; and San Jose, Calif., representing three of the four major regions within the country (South, Midwest and West). In fourth place, New York was the highest-placed Northeastern city in the top 20.
In terms of performances across individual metrics, Columbus earned first place for its industry diversity, while Nashville outranked New York, Philadelphia and Chicago for the variety of office class types within its CBD.
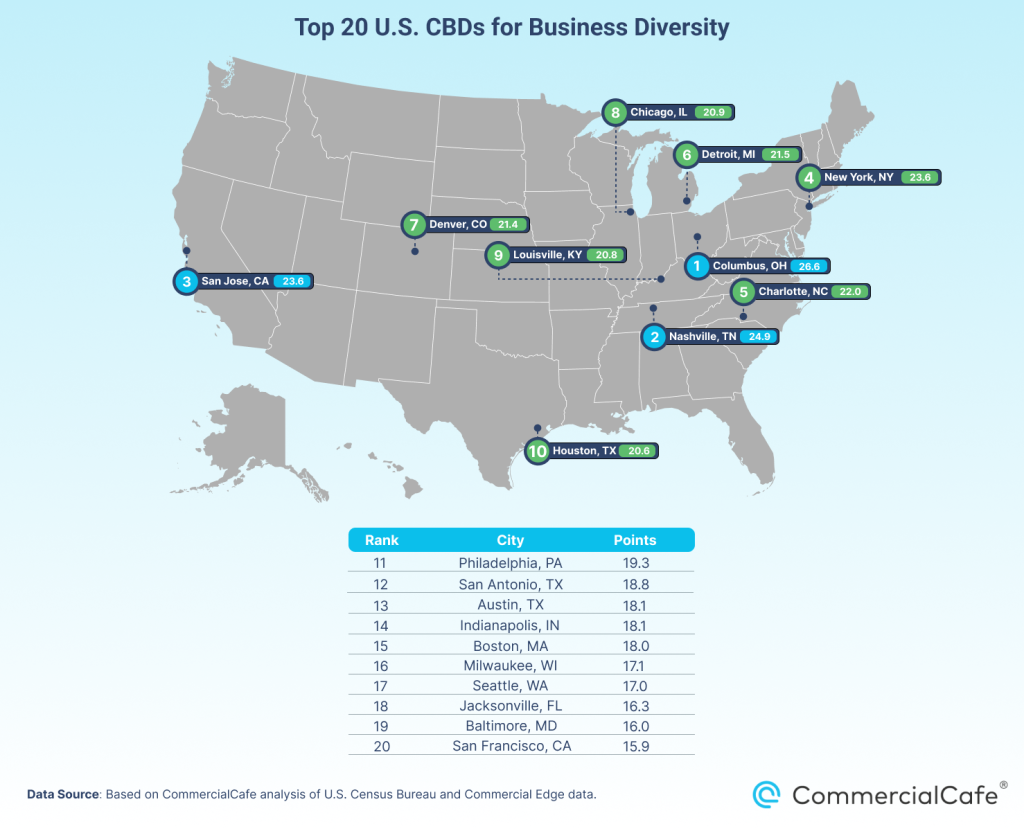 Southern cities also played a major role in the ranking by contributing nearly half of the total number of entries. Noteworthy mentions include Charlotte, N.C.’s fifth-place finish — thanks in large part to the points it received for its employment size diversity and distribution within its CBD — as well as Louisville, Ky. (9th place); Houston (10th place); and Jacksonville, Fla. (18th place).
Notably, some entries’ overall performances reveal the complex challenges of fostering a diverse economic and social environment within downtowns. In particular, Detroit — which topped the list for having the most even distribution of companies by employment size, ahead of both Charlotte, N.C., and Columbus, Ohio — only managed bottom-half finishes for its office class and industry distribution metrics. Ultimately, the Michigan city ended up in sixth place with a 22 out of a maximum of 30 points.
Given the tendency to associate large cities with diversity in all its guises, the fact that New York was the only one to crack the top five among the most populous entries on our list (cities with more than 1 million residents) might appear somewhat surprising. Indeed, with the exception of Chicago in 8th place, all of the other cities in this category ranked in the lower half of the table — Houston (10th place,) Philadelphia (11th place), and, lastly, San Antonio (12th place).
However, it’s important to note that throughout the decades, cities such as New York, Chicago or Houston have tended to attract corporations and startups operating within industries that were on the rise or dominant within a specific region — such as finance, energy, health care or tech. While there are many upsides when, say, tech giants decide to establish a strong presence in Manhattan, the area’s ability to maintain a diverse ecosystem is challenged as developers are increasingly incentivized to build high-end properties, rather than accommodate a variety of businesses.
Open for Business (Across All Industries): Columbus, San Jose & New York Take the Podium
Columbus, Ohio; San Jose, Calif.; and New York were the best-performing entries in terms of their equitability score, meaning they display a much more even distribution of the various industries present within their central business districts. For comparison, entries that rank lower for this index will have a concentration of companies from a small number of industries operating within their CBD.
Columbus received maximum points for this indicator by boasting roughly 4,000 businesses within its CBD, a significant share of which provide technical and scientific services (19%); food and accommodation services (12%); as well as a host of miscellaneous services that fall under the North American Classification System (NAICS) code 81, which includes various repair, laundry, parking or pet care services (10%).
Next, San Jose — which hosts a similar number of firms within its CBD — has professional scientific and technical services contributing 20% to the final tally; with companies related to the construction industry making up a further 9%. Food and accommodation services stand at 11%, and wholesale trade businesses constitute some 8% of total economic activity within the city's urban core.
Tied in third place, we find New York, Jacksonville, Fla. and Houston, sharing the same score on the equitability index, despite the vastly different amounts of economic activity unfolding in their respective downtowns (52,182 companies active in New York’s CBD compared to 3,909 in Houston and 2,757 in Jacksonville).
In the Big Apple, professional and technical jobs — along with wholesale trade — make up one-third of downtown New York’s economic activity. Finance and retail (9% each), along with businesses from the real estate sector (8%) are also heavily represented. Professional and technical service providers are an important component of the economic activity in all cities that made our ranking, but in Houston's CBD, these companies share the stage with accommodation and food services (12%), while in Jacksonville it's health care, retail and construction companies that are also among the most prevalent businesses.
Nashville’s CBD — home to approximately 3,545 companies — displays highest percentage of health care and social assistance (13%), as well as arts, entertainment and recreation services (11%). That means that nearly one-quarter of all firms active within the CBD belong to those two industries. Additionally, some 17% of establishments offer professional, scientific and technical services, and another 14% are classed as accommodation and food service providers.
“The entertainment factor — the buzz factor — has become so important, especially with the Generation Z demographic,” said Doug Ressler, business intelligence manager at Yardi. “One of the U.S. downtowns that has really bounced back after the pandemic is Nashville, Tenn. It is still an affordable place to live. It is a really nice place to work. It is a fun place for people.”
At the same time, Boston and San Francisco recorded the lowest equitability scores within the list. For instance, if we look at the distribution of companies pertaining to various industries within the Northeastern city’s CBD, there’s a noticeably heavier tilt toward only a couple of sectors. Specifically, 28% of the 5,265 companies that are operational in the area are classified as professional and technical businesses, whereas 17% are financial service providers. None of the firms conducting activities across the other industries hit double digits in terms of percentage share of downtown Boston or San Francisco’s business landscape.
Detroit Claims Most Even Spread of Small, Mid-Sized & Large Businesses Across its CBD
When it comes to the distribution of existing businesses by their numbers of employees, entries from the South and Midwest have the highest equitability scores within the top 20.
As an example, Detroit garnered maximum points for this metric with 63% of firms having fewer than 10 workers and 26% reporting a workforce of 10 to 49 employees. The city is also home to ten of the Fortune 500 companies located in the state of Michigan. Some of the largest employers locally include the likes of Ford Motor Company, Stellantis and General Motors. Unsurprisingly, 8% of firms in the city’s CBD have a staff of 50 to 249 workers, while even large companies make up an additional 2% of the total.
Next, a perennial presence in rankings listing the best U.S. cities for startups — as well as the home of many domestic and international corporations that employ a sizeable workforce, such as Honeywell, Duke Energy, Amazon, Wells Fargo or Atrium Health — Charlotte, N.C., came in second for the evenness of its businesses by their number of employees with an almost identical distribution.
Looking at entries in the bottom half of the list for this indicator, it’s worth keeping in mind that the equitability formula was applied to CBDs with significant differences in their total employment numbers.
For instance, New York City is head and shoulders above any other entry in the ranking due to the sheer number of people that work within its CBD (51,172 professionals). Of these, 72% are employed in firms with fewer than 10 workers, which means that New York boasts the highest percentage of small companies operating within the downtown area across the top 20. However, across the our ranking, New York also has one of the lowest percentages of firms that have a staff of 10 to 49 workers within our ranking (21%), as well as those with a workforce of 50 to 249 employees (6%). That said, the relative unevenness of this employment size distribution ultimately landed it in 17th place for this indicator.
In the Midwest, Chicago — which had the second-largest employment total for its CBD within the ranking — fared better, securing a spot in the upper half of the table, in 7th place.
Of course, the size, diversity and quality of the local talent pool adds a new dimension to this metric. That’s why it’s important to keep an eye on migration trends while looking at these percentages, especially after the disruptions caused by the pandemic. To that effect, Yardi's Doug Ressler points out that while the influence of the COVID-19 pandemic on urban population shifts has not completely faded, recently released Census Bureau estimates suggest a trend toward demographic revival for most of the nation’s largest metropolitan areas and urban core counties.
“Population losses in these places are subsiding and, in some cases, turning into gains that are approaching pre-pandemic levels,” he said.
A Balanced Mix of Trophy Towers & Affordable Office Spaces Within the CBD: Austin & Nashville Outrank NYC
Somewhat surprisingly, Austin and Nashville, Tenn., outperformed New York City in terms of the equitability score for the office space distribution by class within its CBD by a fine margin. Some 22% of Austin's office inventory consists of Class A+ properties, with an additional 56% labelled as Class A.
Roughly 41% of the office space in Nashville's CBD consists of Class A properties with a further 39% made up of Class A+ trophy assets. However, Nashville also has a healthy amount of older office buildings available — 19% Class B properties and 1% Class C properties.
New York City features a very similar distribution (although, given the magnitude of its office inventory, at a much larger scale). For context, New York’s office inventory located within its CBD stands at roughly 371 million square feet. Thus, the city’s 33% of Class A buildings translates to 169 million square feet of space — more than 40 times the amount present in Nashville’s CBD.
As we reach the second half of the ranking for this indicator, the dominance of certain class types at the expense of others becomes more pronounced as the entries’ equitability scores for this metric decline.
For example, while San Antonio managed a sixth-place finish for this indicator, its percentage of older, more affordable Class B office buildings is among the highest across the ranking. With 47% of its office inventory consisting of such buildings, only Detroit — sporting a much less-balanced office mix — has a higher share of Class B workplaces within its downtown.
Worth mentioning is the case of Charlotte, N.C.,, where the real estate market is also heavily tilted toward state-of-the-art workspaces that tend to command higher asking rents: 42% of overall office space within the CBD is labeled Class A+, another 53% are Class A, and only 5% Class B.
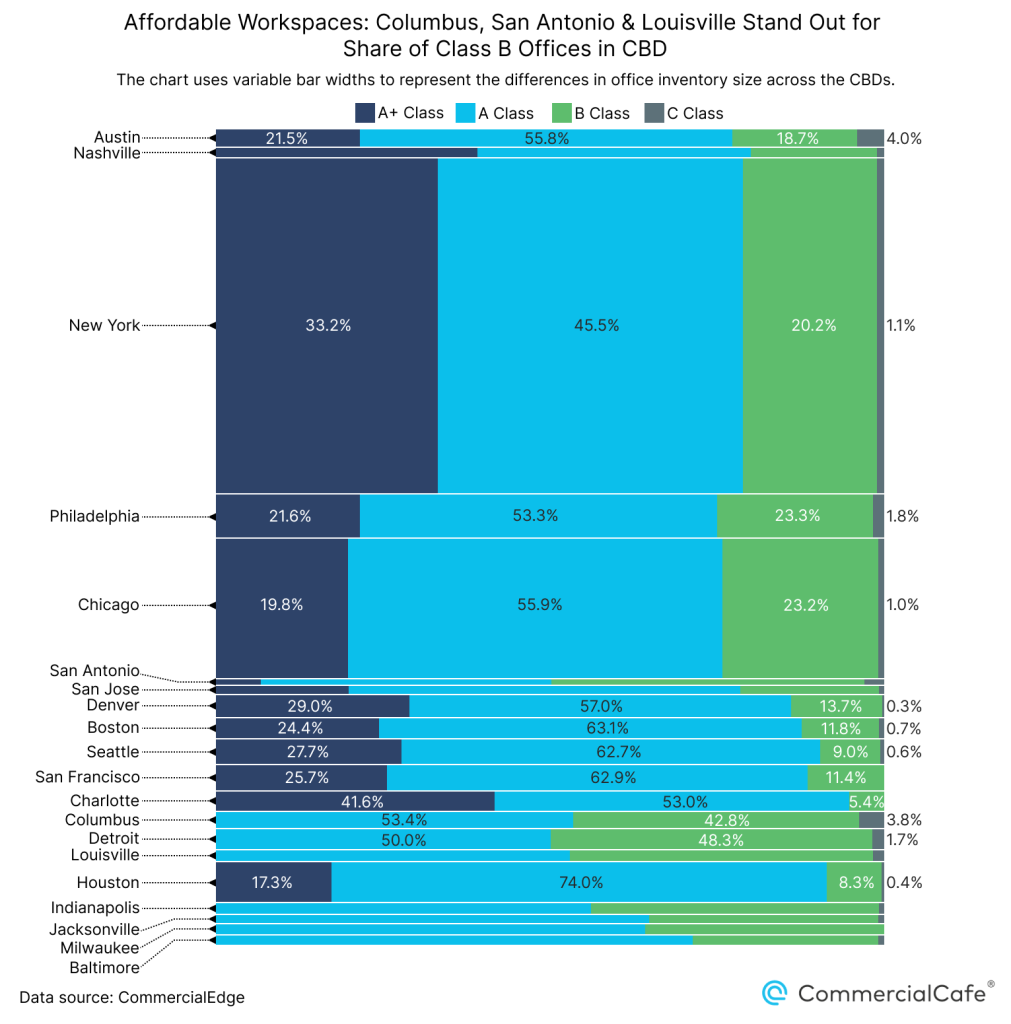 At the opposite end, there’s a significant contingent of Southern and Midwestern entries occupying the bottom half of the list for this indicator with little or no Class A+ office towers built within their respective business districts. For instance, the overwhelming majority of office spaces in Baltimore or Jacksonville’s CBDs are labeled Class A (71% and 65%, respectively), while in Detroit and Louisville, Ky., there’s a relatively equitable split between Class A and Class B properties, but neither of these have options for those seeking the most highly rated workspaces.
Methodology
We ranked metro areas with populations of at least 500,000 residents for which CBD ZIP codes could be identified in the Commercial Edge database. Each metro CBD could score between zero and maximum points across each category. Points were awarded directly proportional to each metric. We used establishments data as per U.S. Census data for 2021.
The diversity index was calculated for business industry, establishment employment size and office building class using the Equitability Index formula: