- Office investment sales drop 63% y-o-y in Q1
- Average prices inch back towards the $200 mark
- Houston Marathon Oil Tower finally sells in largest Q1 deal
- Over 6 million square feet of new product on track for Q2 delivery
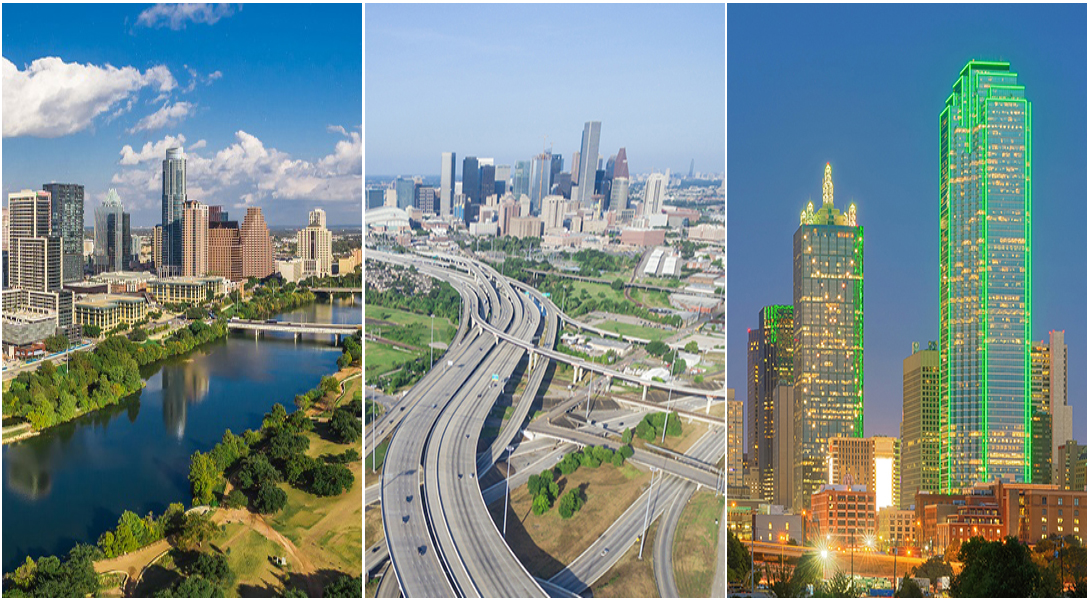
Texas’ top-tier office markets were off to a slow start this year, wrapping up what looks like one of the worst quarters of the last five years. The dollar volume dropped 63% year-over-year, concluding Q1 with $504 million in disclosed-price transactions, while prices climbed to an average of $199 per square foot. The 5.6 million square feet of inventory that traded during Q1 was the lowest quarterly total in five years. At the same time, developers have been hard at work—nearly 4.8 million square feet of product were delivered in the Austin, Dallas-Fort Worth, Houston, and San Antonio office markets in Q1, and an additional 6.7 million square feet are on track for delivery in Q2.
Texas Office Sales Drop 63% Y-o-Y in Q1
The $504 million in disclosed-price Q1 transactions marks a 63% year-over-year decrease in dollar volume, making it the worst-performing quarter in five years. Out of the 22 sales recorded in Q1, only 10 were disclosed-price transactions. Even though sales amassed in the remaining 12 deals would help paint a more favorable picture, overall office sales activity remained slower than usual—Q1 was the first quarter in five years when fewer than 30 major office deals closed across the top four Texas markets.
Quarterly sales activity was mostly carried by the DFW and Houston office markets, where 19 assets traded through March. The Dallas–Fort Worth metroplex was the most active in terms of number of deals closed—11 sales were recorded during Q1 for $87 million (prices for 7 of the 11 transactions were undisclosed). By contrast, assets sold on the Houston office market accounted for 80% of total Q1 Texas office sales—$343 million in disclosed-price transactions. Three sales closed on the Austin market, two of which had undisclosed prices, while no office properties larger than 50,000 square feet changed hands on the San Antonio office market during Q1.
Average Price per Sq. Ft. Recovery Stops Short of $200
The average price per square foot for office properties trading on the four combined Texas markets dropped 32% year-over-year. Resting at $199 per square foot through March, average prices are inching back up from falling in Q4 2017, after having reached peak values of nearly $300 per square foot.
The highest prices were recorded on the Houston office market, where assets traded at an average of $144 per square foot in Q1. In the Dallas-Fort Worth market, office properties commanded an average of $108 per square foot. No average price could be calculated for the Austin and San Antonio office markets, due to low disclosed-price sales activity.
Uptown Houston Tower Trades in Top Q1 Office Deal
Although the Houston office market has been struggling as a consequence of crude oil hovering at the $50 per barrel bull/bear line, it remains one of the best six markets for investment in 2018. Eight deals closed here during Q1—half the number of sales that were recorded during the previous quarter. Even so, the Houston office market concluded Q1 with the highest dollar volume—a trend that is consistent among the top four Texas markets.
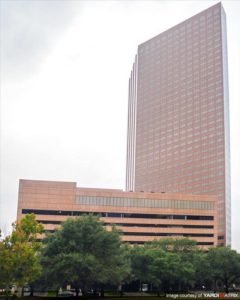
Not surprisingly, Space City was home to the largest sale of the quarter. Baupost Group and M-M Properties partnered up and paid $175 million for the Marathon Oil Tower that CBRE had previously acquired in 2013 for $246 million. This was the third time that the 1.2 million-square-foot Uptown Houston office property was put on the market since 2015. Sold at 90% occupancy, roughly two thirds of the property is leased to anchor tenant Marathon Oil through 2021. The new owners plan to spend more than $25 million on upgrading the building’s public spaces and garage, and adding a modern conference center and new dining amenities. This transaction is further indication that investors believe the market has bottomed out and are anticipating a solid recovery over the next few years.
Austin was home to the second-largest deal of the quarter. In January, Lionstone Investment completed the aquisition of two Rollingwood Center office buildings for an estimated $74 million. Completed in 2015 by Endeavour Real Estate, the Southwest Austin office properties encompass 214,587 square feet, and were reportedly sold fully leased to six tenants.
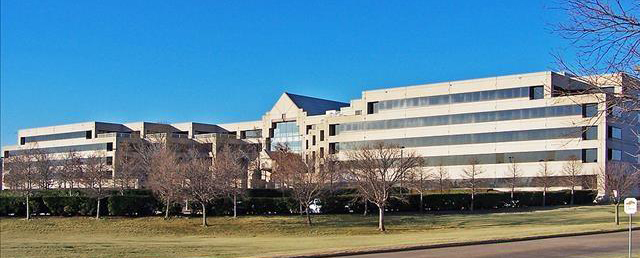
By contrast, the largest disclosed-price deal to close during Q1 on the Dallas-Fort Worth office market clocked in at a modest $45 million in March, when Sooner Management acquired the 405,734-square-foot Irving office property at 1925 West John Carpenter Freeway.
Tech Companies, Corporate Consolidations Drive Development in Austin, Dallas
The combined Texas office markets will welcome nearly 11.5 million square feet of new inventory by the close of Q2, 4.8 million square feet having already been delivered through March. Some of the larger projects to come online are corporate campus developments that consolidate various financial and tech companies’ regional operations.
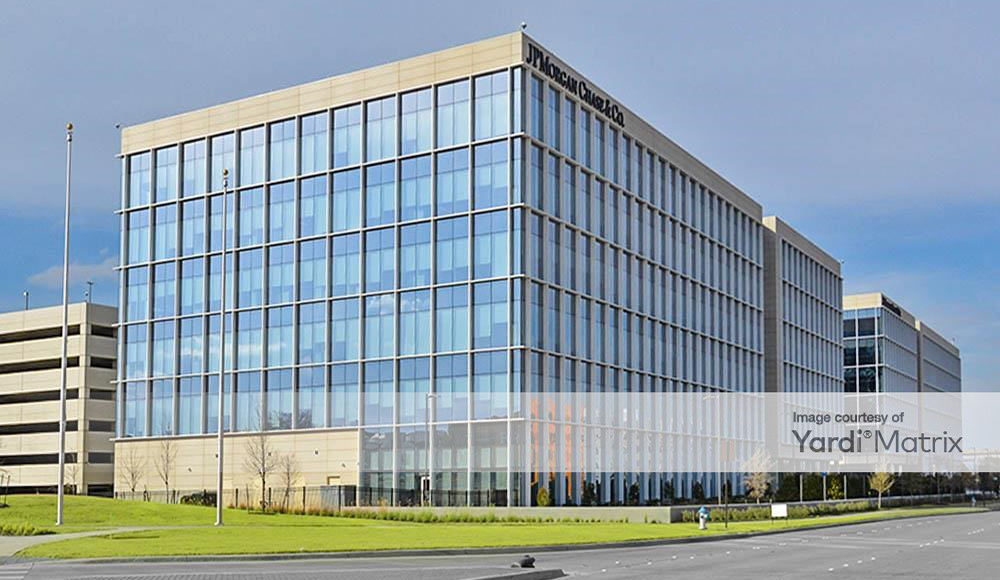
January 2018 marked the completion of the JP Morgan Headquarters at Legacy West, in Plano—the largest of the 17 projects to be finalized during Q1. The massive 1.4 million-square-foot regional campus will bring roughly half of the firm’s 12,000 North Texas employees under one roof. It includes four buildings that flank Main Street—a pedestrian-friendly corridor designed to create a community-type urban feel for the employees. JP Morgan’s Legacy West headquarters includes the country’s largest conference center, which can accommodate up to 800 people, and is intended to serve the financial company’s major international meeting events.
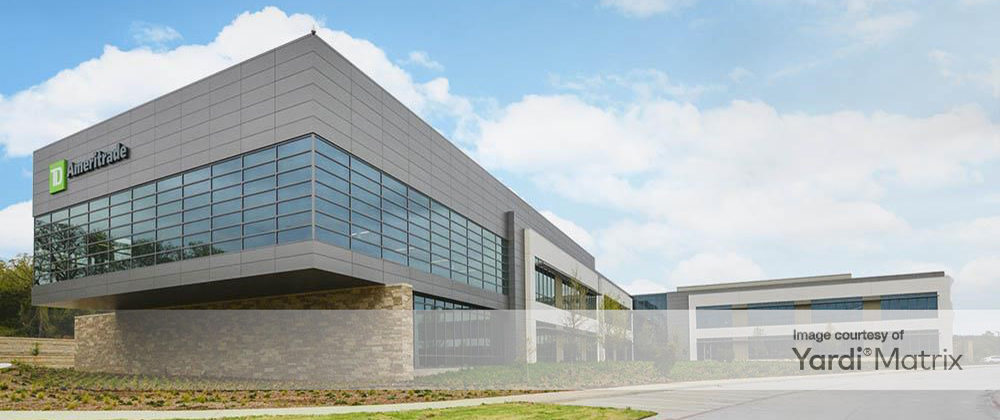
In February, Omaha-based financial services firm TD Ameritrade opened its new headquarters at 1051 West Kirkwood Blvd in Southlake, consolidating the financial services, technology, and operations staff from the company’s North Fort Worth location. Situated on a 78-acre parcel, the 355,000-square-foot project is designed to house up to 2,000 employees, and encompasses a two- and three-story building, a 2,111-car parking garage, and a fitness center.
Oracle’s belief in Austin as a vibrant tech hub most recently manifested in the form of the Waterfront Oracle Campus located in the East Riverside Drive corridor, just outside Downtown Austin. Completed in March, the 560,000-square-foot property is designed to appeal to and address the needs of Austin’s Millennial-rich tech talent pool. The site includes outdoor terraces, a fitness center, a “tech bar” where employees can get their computers and devices repaired, as well as an on-site cafeteria complete with video games and television screens.
A total of 34 projects are on track for delivery in Q2, encompassing roughly 6.7 million square feet. Office development in Texas remains heavily concentrated in the Dallas-Fort Worth metroplex, where 16 projects totaling 4 million square feet are due for completion by the end of June 2018. These include the 1 million-square-foot Liberty Mutual towers I and II being constructed at Legacy West (due in June), and the 20-story, 500,000-square-foot PwC Tower at Park District that is being developed by Trammell Crow in Uptown Dallas (due in May).
Austin’s emerging tech hub appeal has made it Texas’ second major development cluster, with 11 office projects totaling 1.8 million square feet nearing completion in Q2. Noteworthy developments include Stonelake’s Domain Tower, which topped out last fall and is due for completion before the end of May 2018—the 310,000-square-foot North Austin office property will be fully occupied by tech company Indeed.
Corporate hubs that are nearing completion in the Austin office market include the 270,000-square-foot Texas Mutual Insurance Co. headquarters in East Austin, and the Charles Schwab headquarters in North Austin, both due in June 2018.
Methodology
We delved into Yardi Matrix data to analyze all office transactions with price tags equal to or exceeding $5 million to close in Texas during the first quarter of 2018 (January through March). Our analysis, based on data recorded up until April 16th, 2018, includes completed office buildings equal to or larger than 50,000 square feet that changed owners during the quarter. Regarding mixed-use assets, only properties featuring over 50% office space were taken into account. We considered portfolio deals as single transactions and excluded distressed sales altogether. To make sure the trends and comparisons presented in our analysis are valid, we excluded portfolio, partial interest and ground lease deals from our calculation of the average price per square foot.
Although we have made every effort to ensure the accuracy, timeliness and completeness of the information included in this report, the data is provided “as is” and neither CommercialCafe nor Yardi Matrix can guarantee that the information provided herein is exhaustive.
Property images courtesy of Yardi Matrix.

