Experts are still trying to gauge the long-term effects of the COVID-19 pandemic on the economy. Even so, it’s vital to have a good initial understanding of the state of business creation and longevity in the U.S. prior to the most recent disruption.
For instance, the recession that began in 2008 led to many upheavals in the U.S. economy — from home foreclosures and major financial institutions defaulting to business closures throughout the nation. In fact, in 2008 alone, the country lost nearly 120,000 enterprises — and that downward trend continued for another few years. By 2018, the U.S. economy had recouped and increased its total number of active companies, but the progress proved to be uneven across industries, as well as states.
Accordingly, this study provides an overview of the business landscape between 2008 and 2018 by focusing on net gains or losses in the total number of active businesses, as well as the specific industries and states in which these changes were most notable. In particular, this report compiles the latest U.S. Census data for the continental states and Washington, D.C. for the following metrics: the average age of businesses; the average size of businesses (number of employees) and the share of the employed labor force they utilize in each state; as well as the number and distribution of businesses across sectors of the economy.
Key takeaways:
- U. S. active business totals increased by 2.5% or 146,000 firms since 2008
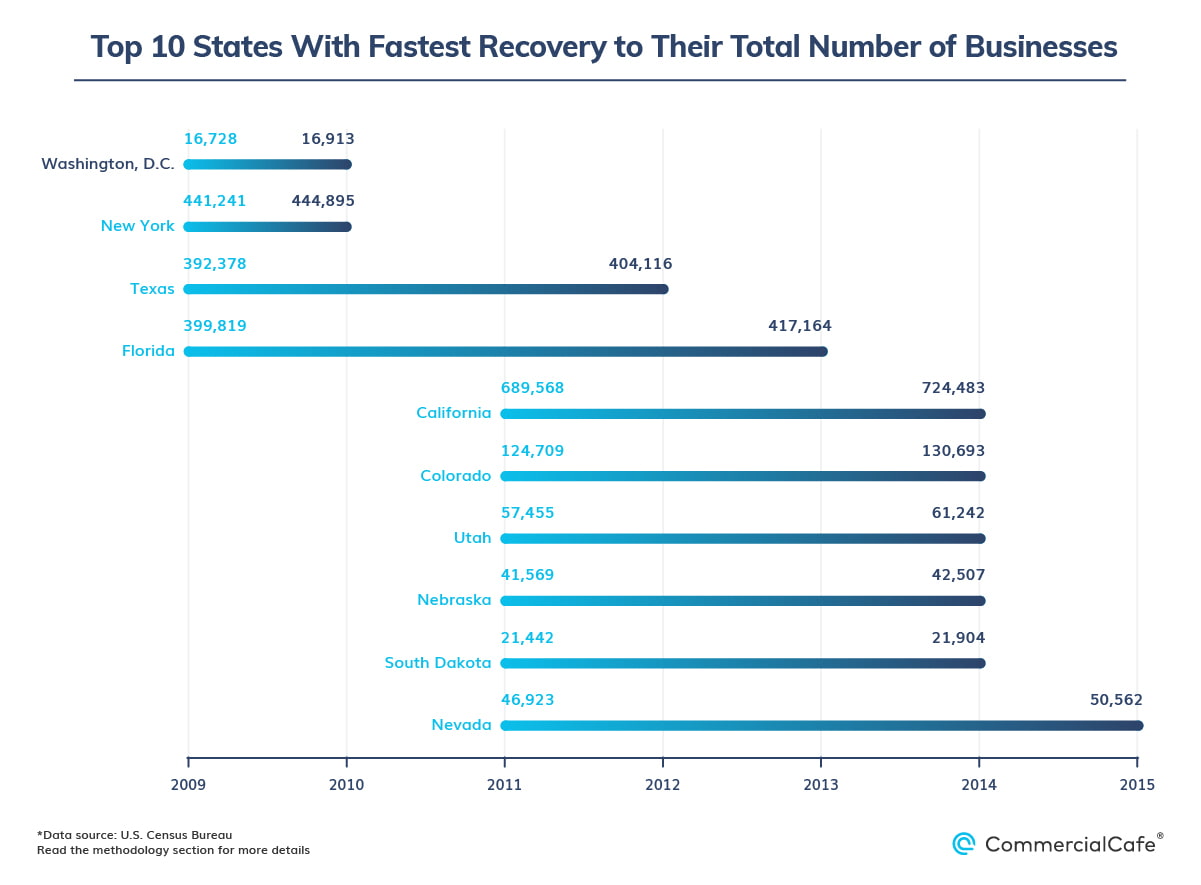
- Washington, D.C., New York, and Texas had the fastest recovery in total firm numbers following the recession
- Businesses in educational services witnessed largest net gains by percentage – 21.5% between 2008-2018
- 72,000 additional accommodation and food service companies were established in the 2008-2018 decade – the highest increase in active businesses across all industrial sectors
Keep reading to find out more about national trends in business creation and churn rates prior to the onset of the COVID-19 crisis, as well as state-level highlights.
2.5% Growth in Number of U.S. Businesses Between 2008 – 2018; Accommodation & Food Service Gains Net Total 72,000 Firms
Stability and predictability are essential for nurturing a healthy business environment. But, in the aftermath of the financial crisis and its domino effect on the rest of the economy, companies struggled to stay afloat. Moreover, until 2012 – when the trend slowly changed course and started inching closer to pre-recession values – the U.S. had witnessed the closure of roughly 204,000 companies.
Yet, by 2018, the number of U.S. businesses had increased from 5.9 million to an estimated 6.1 million, following a 2.5% growth throughout the decade.
Specifically, Washington, D.C. and New York were the first to bounce back from the crash in 2010. Fortunately, their lowest points in 2009 turned out to be comparatively minor dips and were followed by a swift recovery in terms of business numbers.
Meanwhile, states such as California, Colorado, Nebraska, South Dakota and Utah bottomed out in 2011, only to make up for their lost numbers of firms by 2014. Nevada rounded out the list of the top 10 fastest-recovering states after the recession with its comeback in 2015.
Notably, with millions of Americans going back to school during the recession — eager to stave off unemployment or improve their job or business prospects — firms falling under the educational services category witnessed a 21.5% hike during the 10-year period.
Granted, some of this growth was aided by a push toward education at the federal level, as the 2009 Recovery Act increased both the amount of Pell Grants to low-income students, as well as the number of eligible people. By 2018, with the addition of 17,000 active companies to the roster, the final tally for the decade stood at 95,554.
Considering the effect of the COVID-19 epidemic on the economy, it will be worth keeping an eye on education service numbers in the next few years, especially given the rise of remote learning and the public’s interest in personal development and skillset diversification opportunities.
Notably, despite being initially excluded from stimulus packages, the arts, entertainment and recreation industry had the second-largest percentage increase in businesses at 16.5%. More precisely, the sector added 19,000 companies over the course of the decade, reaching 134,432 by 2018. However, the gains have not been uniformly distributed across the industry.
For example, growth in the gambling business is tied to economic expansion, and only lottery consumption appears to be recession-proof. Similarly, digital distribution and streaming has been on the rise for years now — and the pandemic has only added to that trend. In contrast, museums, art centers, and theaters faced financial insecurity due to endowment cuts and insufficient private funding.
Likewise, with a large portion of the Baby Boomer generation retiring, healthcare and social assistance companies also contributed copiously to the growth of U.S. businesses: Throughout the course of the decade, the number of active firms increased by 43,000 — bringing the sector-wide total from 621,000 to 663,800. Some of the largest gains in terms of healthcare and social assistance firms were in California, Texas and Missouri.
At the same time, the rise of the gig economy spurred the creation of companies that operated in the accommodation and food service sector, resulting in a net gain of 72,000 active companies between 2008-2018. In fact, the latest estimates suggest that there are approximately 550,000 active companies within the industry, which represents around 9% of the total number of U.S. firms.
It’s also important to note that accommodation and food service enterprises have often stepped in to fill gaps created by the decline of activity in other sectors. As an example, in California, the overall expansion of the hospitality sector has played a major role in replacing some of the jobs and businesses that were lost due to the decline of defense spending in the state.
U.S. Economy Sheds 50,000 Active Retail Businesses Between 2008-2018
Unfortunately, the decade following the financial crisis was also marked by an increased churn rate for businesses operating in certain industries. For instance, since the 1970s, the decline of manufacturing has been sort of par for the course, with roughly 35,500 firms going under between 2008-2018. But, the number of construction businesses also fell by 5.5%, going from approximately 761,000 to 719,000. The latter sector’s 10-year low point came in 2012 — when the total number of firms shrank to less than 641,000. Plus, the tally is still miles away from its pre-recession levels.
Of course, construction businesses are sellers and buyers of several materials and adjacent services, which means that any changes in that sector will have an influence on companies involved in everything from retail to mining and finance.
Indeed, retail trade has been the hardest hit, losing the greatest number of companies during the decade studied. The sector’s decline is due to several simultaneous changes that have been reshaping the U.S. economy since 2008, chief among them the shift to e-commerce, along with increased difficulty in refinancing retail assets. By 2018, roughly 50,000 companies had gone under, marking a 7% decline. Some of the states that were most affected by the drop were California, Ohio, Illinois and Pennsylvania.
To read highlights on specific states, click on the inverted chevron to expand the items in the list below.
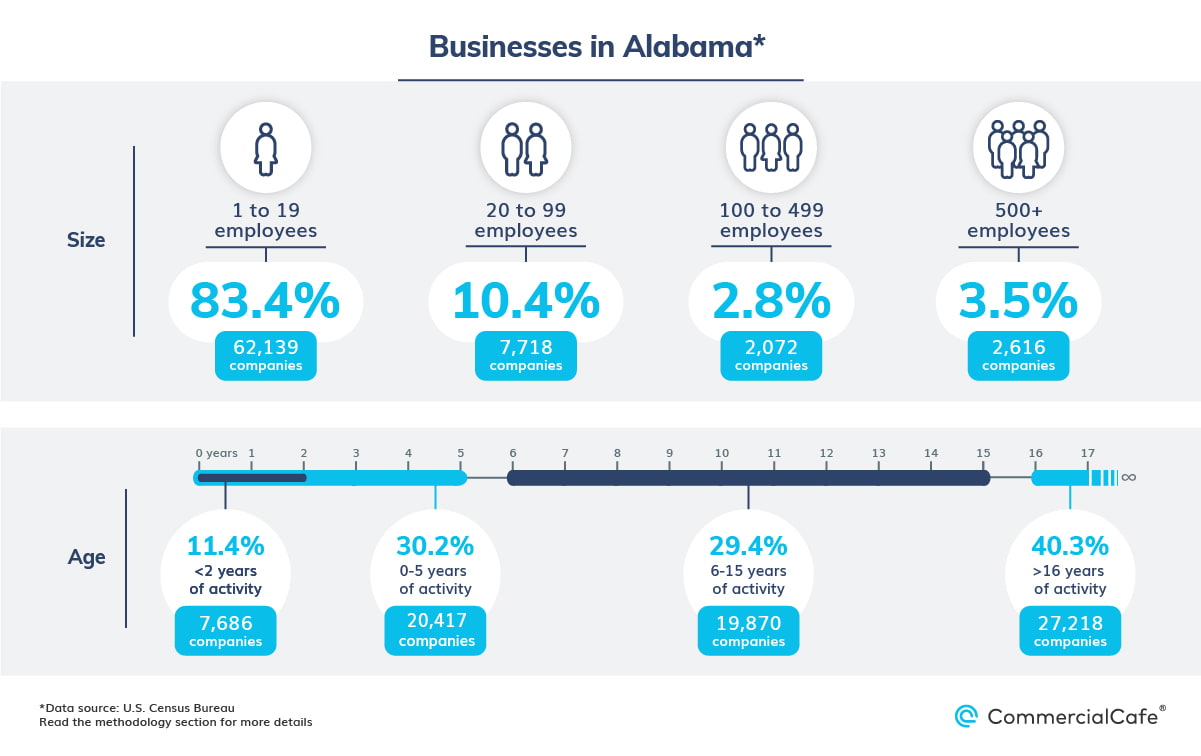
Between 2008-2018, the total number of firms in Alabama fell by 7%. Here, roughly 5,300 companies went out of business, with important losses in the construction (2,219 defunct businesses) and retail sectors (1,270 defunct businesses).
According to the latest records, 83% of companies in the state employ fewer than 20 people, and 30% have been active for five years or less. Conversely, larger firms – with more than 500 employees – make up 4% of the total and provide jobs for around 922,000 Alabamians.
With a workforce of approximately 60,000, the U.S. Army’s Redstone Arsenal in Huntsville is the largest employer in the state. Recently, it was selected as the site of the U.S. Space Command’s headquarters, due, in large part, to the presence of aerospace and defense companies within the local industrial base.
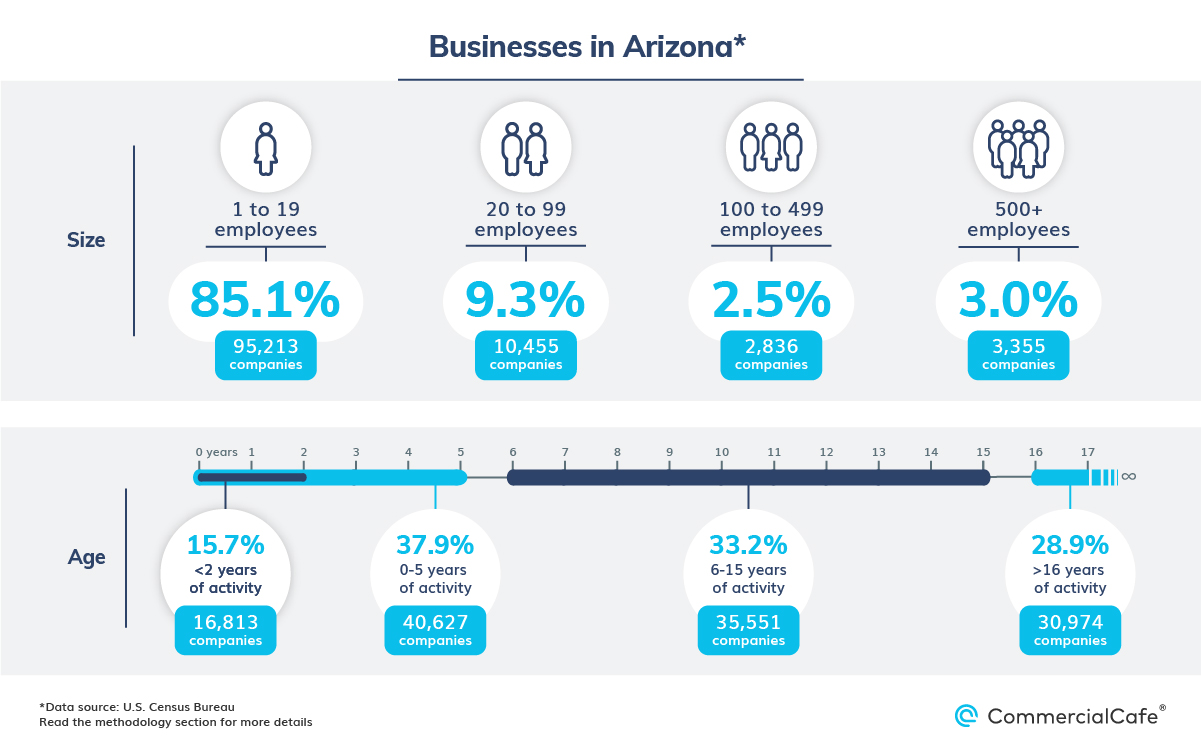
Arizona has 111,859 active businesses, with a ratio of 1,494 firms per 100,000 residents. Roughly 29% of companies have been in business here for at least 16 years, while 38% have been operating for five years or less. Companies with fewer than 20 employees constitute 85.1% of the total and employ roughly 361,320 Arizonians.
In 2008, just as the recession hit, Arizona had roughly 110,000 active businesses. Three years later, that number had shrunk to less than 101,000. However, following several years of steady growth, the state closed out the 10-year period with a 2% increase.
Businesses providing professional, technical, and scientific services — as well as those in the healthcare sector — fared particularly well. The former grew by 10% (from 15,510 to 16,984 companies), while the latter rose by 13% — a net increase of 1,636 firms.
Finally, although the number of real estate rental and leasing companies rose by nearly 1,500 between 2008 and 2018, businesses in the construction sector experienced a 19% drop overall — on the back of a somewhat slow-paced recovery.
Attracting top talent is paramount to the success and longevity of businesses today. With many workers prioritizing flexibility in the workplace, there has never been a better time for exploring shared office options in your area. Use CommercialCafe’s intuitive and extensive database to check out some of the best coworking spaces in Phoenix.
In the aftermath of the financial crisis, it took a few years for business creation in California to recover and then surpass pre-recession levels. Even so, beginning in 2014, the numbers really took off, resulting in a 9% increase throughout the 10-year period: California recorded a net gain of 62,692 total firms between 2008-2018, roughly 7,000 more than runner-up Texas.
In particular, the growth of transportation and warehousing companies played an important role in the dynamism of the state’s business landscape, as well as the strength of its industrial real estate market. And, barring minor vacillations in the early years of the recovery, the sector registered consistent yearly increases, which totaled 21,657 firms by 2018. That’s a 23% hike in the number of businesses being created throughout the decade.
Plus, as the land of startups and home to some of the greatest business success stories, California would likely top the list of places where young companies would be presumed to occupy a sizeable share of the economy. And, looking at the raw numbers, no other state comes close to matching California’s 113,126 firms in this category. However, in terms of percentages, the state’s share of companies with fewer than two years of activity doesn’t even crack the top five, which is headed by Florida and followed by Nevada, Idaho, Utah and Texas.
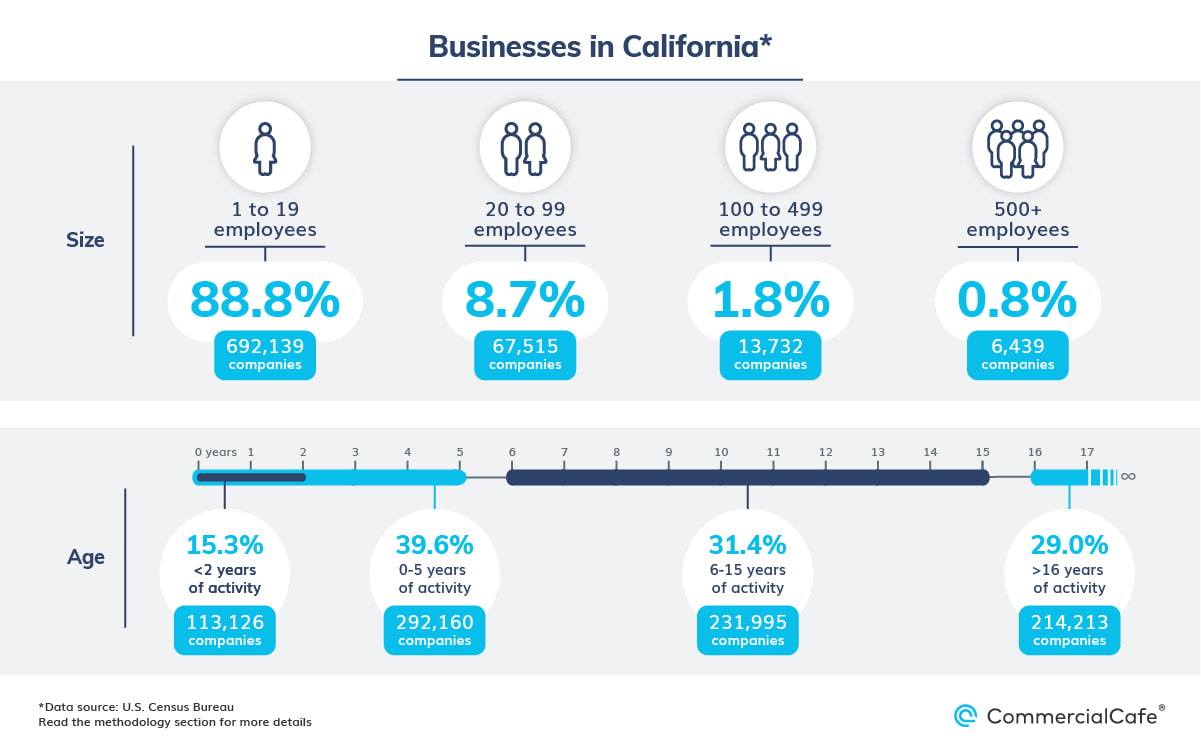
Companies with up to 20 employees make up roughly 89% of California businesses and employ approximately 2.65 million workers. Meanwhile, some 2.1 million people work at firms with 100 to 499 employees, while roughly 7.9 million are employed by companies with a staff of more than 500. Top employers here include a mix of public services and educational institutions; local government; and business giants, such as Disney and Alphabet.
Attracting top talent is paramount to the success and longevity of businesses today. With many workers prioritizing flexibility in the workplace, there has never been a better time for exploring shared office options in your area. Use CommercialCafe’s intuitive and extensive database to check out some of the best coworking spaces in Los Angeles, coworking spaces in San Francisco, coworking spaces in San Jose, coworking spaces in San Diego, coworking spaces in Irvine, coworking spaces in Santa Monica, coworking spaces in Sacramento or coworking spaces in Long Beach.
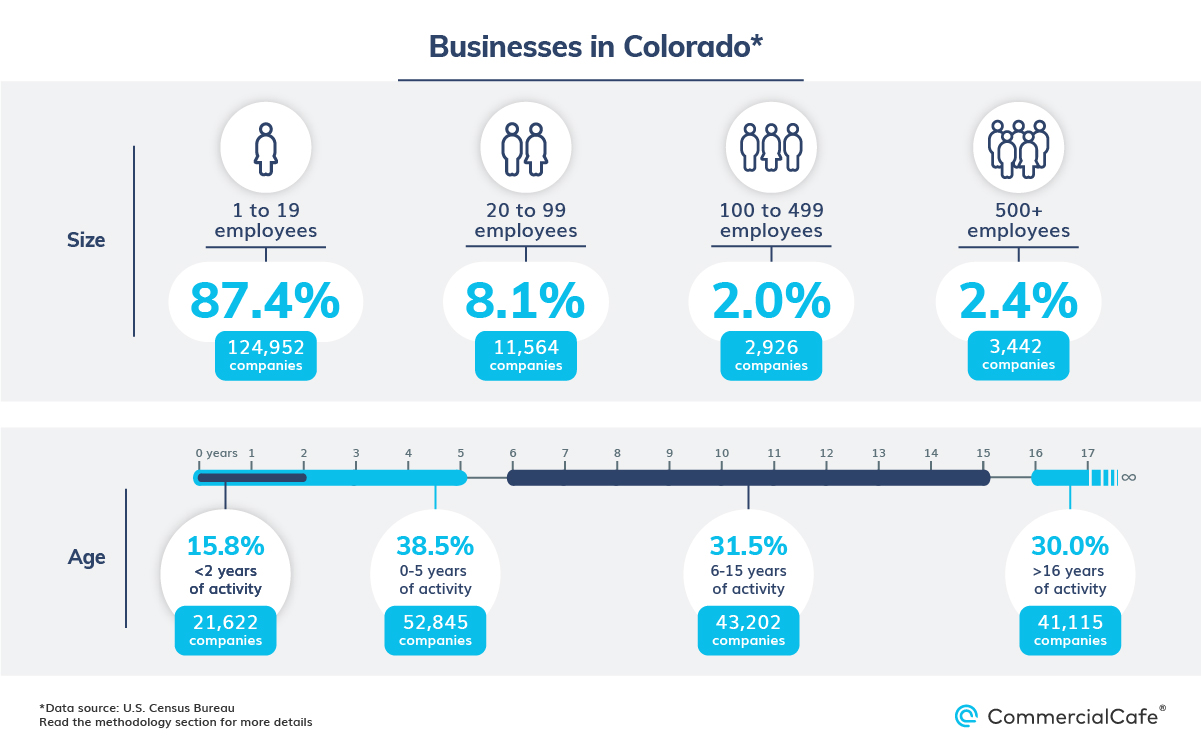
There were roughly 142,884 businesses in Colorado in 2008, with a particularly strong showing from construction; health; retail; and professional, scientific, and technical service companies. Throughout the 10-year period, that number increased by 10% as the state witnessed a flurry of active businesses in both education and the tech sector – with edtech firms like Udemy, Guild Education or Pearson among them. Real estate rental and leasing companies also thrived. The number of active companies in Colorado increased by 2,641 firms between 2008-2018 – a 32% hike over a decade.
Notably, Colorado also has one of the lowest percentages of firms that have been in business for 16 years or more — only 30%, compared to a national average of 38%. At the same time, its ratio of young enterprises (active for two years or less) is among the highest in the nation, standing at 380 per 100,000 residents — a fact that further reinforces Colorado’s image as one of the leading startup hubs in the U.S.
Attracting top talent is paramount to the success and longevity of businesses today. With many workers prioritizing flexibility in the workplace, there has never been a better time for exploring shared office options in your area. Use CommercialCafe’s intuitive and extensive database to check out some of the best coworking spaces in Denver or coworking spaces in Boulder.
Florida boasted some 464,687 active companies by the end of 2018 — a 12% increase throughout the decade, with a net increase of 50,000 firms. The business-to-population ratio stands at 2,100 firms per 100,000 residents.
About 91% of the total number of companies in Florida have fewer than 20 employees, and only 1% employs more than 500 people. While larger companies hold a relatively modest share of the state’s total, the likes of Disney, Epcot, Adventhealth and Johnson & Johnson occupy approximately 70% of Florida’s employed labor force. For comparison, companies with up to 20 workers employ around 16% of Floridians.
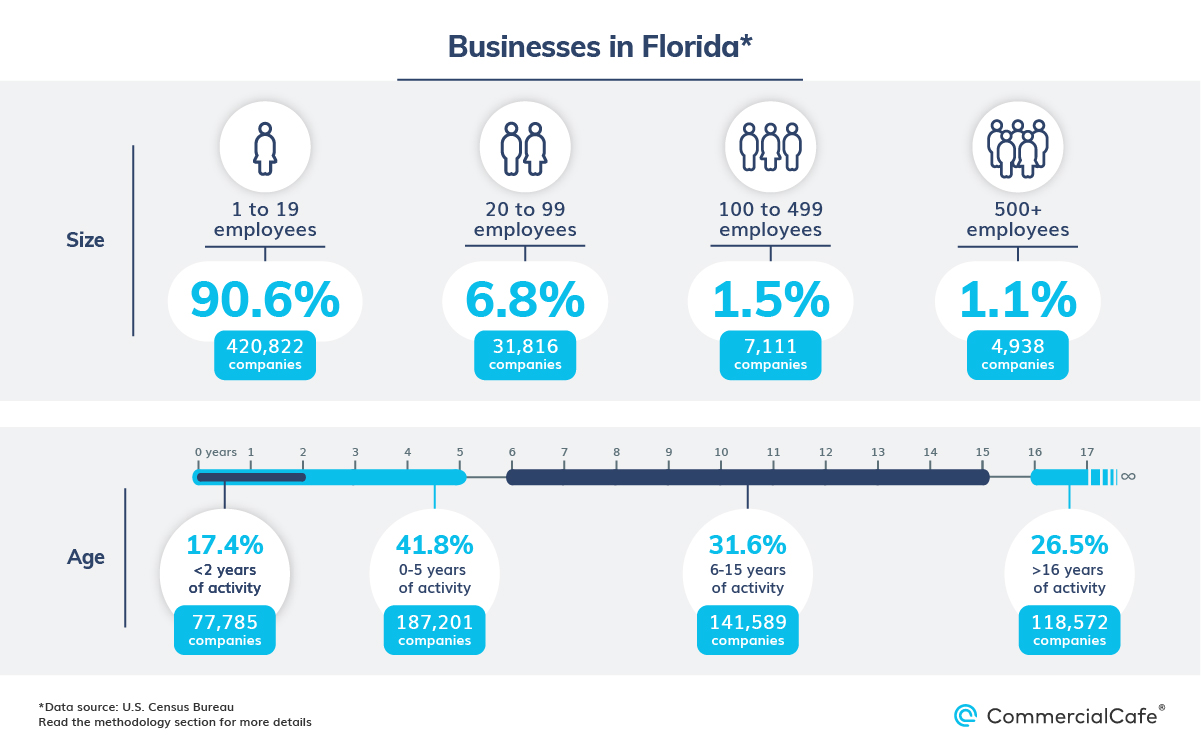
What’s more, enterprises that have been active for 16 years or more hold the largest share of the state’s economy, with approximately 118,572 firms that represent 27% of the statewide total. On the other hand, young businesses with less than two years of activity account for 17% of the overall total, while those active between six and 15 years make up 31.6% of all firms.
Unfortunately, the post-recession years have been challenging for the retail industry, and a vast majority of states recorded declines in the number of companies operating in this sector. But, there were a few exceptions, and Florida stands out among them. It leads the list with 1,763 additional active retail businesses created during a 10-year period — outperforming even New York nearly two to one. The share of Florida retail firms within the national total also rose from 6.6% in 2008 to 7.4% by 2018.
Specifically, companies operating in the professional, scientific and technical services sector were major contributors to the state’s business count throughout the decade, adding some 11,000 enterprises — the third-largest increase in this category, behind California and within a hair of Texas.
Meanwhile, the second-fastest-growing sector for businesses in the state was the real estate rental and leasing industry, followed by healthcare and construction. Florida was also among the top three states for net gains in the number of businesses in the education, as well as arts, entertainment and recreation sectors.
Attracting top talent is paramount to the success and longevity of businesses today. With many workers prioritizing flexibility in the workplace, there has never been a better time for exploring shared office options in your area. Use CommercialCafe’s intuitive and extensive database to check out some of the best coworking spaces in Miami, coworking spaces in Tampa, coworking spaces in Jacksonville, coworking spaces in Orlando, or coworking spaces in Fort Lauderdale.
Among states in the South, Georgia recorded the third-highest net increase in its number of businesses with an overall growth of 2%, bringing the state’s tally from roughly 180,000 businesses in 2008 to 184,000 in 2018.
Here, the healthcare industry contributed the most to the expansion of the local business landscape, adding 1,765 firms to Georgia’s economy. Large-scale projects in the pipeline, such as the expansion of NGHS’s North Georgia Medical Center in Gainesville — one of the most significant developments in the state’s recent history — are a token of Georgia’s ongoing success in attracting and nurturing businesses in the healthcare sector.
Yet, despite its ranking and 10-year growth, Georgia marks a clear separation in terms of the sheer scale of business activity among Florida, Texas and the other Southern states. For example, both Texas and Florida experienced double-digit increases, which have materialized into tens of thousands of additional active companies. But, neither Georgia nor the two Carolinas surpassed the 5,000 mark for businesses created since 2008.
Attracting top talent is paramount to the success and longevity of businesses today. With many workers prioritizing flexibility in the workplace, there has never been a better time for exploring shared office options in your area. Use CommercialCafe’s intuitive and extensive database to check out some of the best coworking spaces in Atlanta.
Throughout the last decade, the total number of firms in Illinois fell by roughly 3,000, fueled by significant losses in the construction, manufacturing and — more important — retail sectors. Here, the number of retail enterprises in the state declined 12%, shedding approximately 3,133 companies in the process. In the Midwest, Ohio is the only other place that has experienced a similar churn rate in the retail sector, and both states are narrowly outranked by California at the national level. Moreover, losses in manufacturing and construction amounted to an additional 4,891 firms closed between 2008-2018.
Even so, Illinois outranked California in the number of additional active businesses in transportation and warehousing. The former’s roster of companies for this industry grew by 48%, from 10,521 firms in 2008 to roughly 15,602 some 10 years later. However, transportation and warehousing was the only industry in which the number of companies grew by the thousands, with relatively modest gains in education, arts, real estate and healthcare.
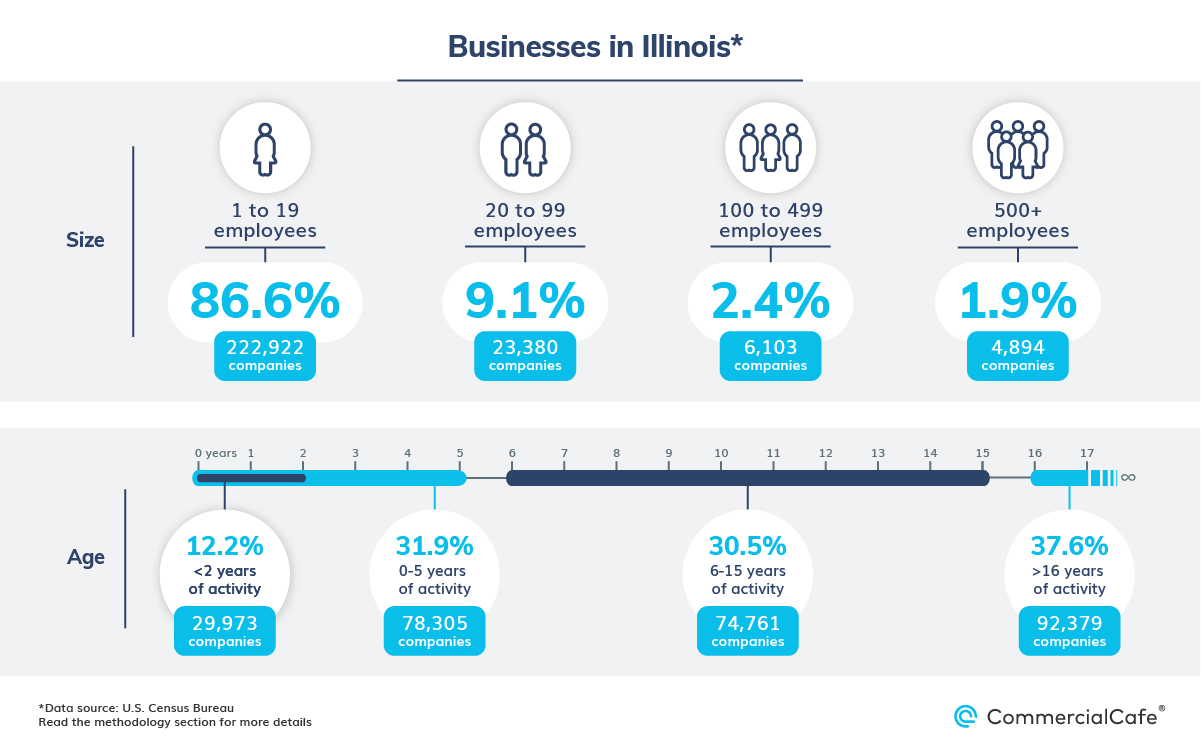
Here, companies with up to 20 workers employ around 15% of the state’s hired workforce, or roughly 827,000 people. These small businesses represent 87% of the overall number of firms, with Illinois ranking fifth nationally for the number of companies within this size range. Additionally, about 12% of all Illinois businesses have fewer than two years of history, whereas those that have been active for between six and 15 years make up 30.5% of the state’s tally.
Attracting top talent is paramount to the success and longevity of businesses today. With many workers prioritizing flexibility in the workplace, there has never been a better time for exploring shared office options in your area. Use CommercialCafe’s intuitive and extensive database to check out some of the best coworking spaces in Chicago.
Between 2008-2018, New York grew its business inventory by 23,129 firms, following a 5% increase in that period — the fourth-largest increase across the 50 states. But, New York’s performances in various industries were consistently outranked by the likes of California, Florida or Texas.
For instance, New York recorded a net increase of 2,638 professional, scientific and technical services enterprises — enough to make the rank of fifth nationally, but also amounting to only about one-fourth of what Texas or Florida added to their tally during the same period, as well as approximately one-fifth of California’s gains. New York also came in third nationally for gains in the total number of active construction businesses. The 2,246 additional construction companies established throughout the decade represented a 5% increase.
In contrast, New York firms operating in the healthcare and social assistance sector didn’t even make the national top 10. The modest 1,000 additional businesses created throughout the decade equated to a total of approximately 44,500 firms in 2018.
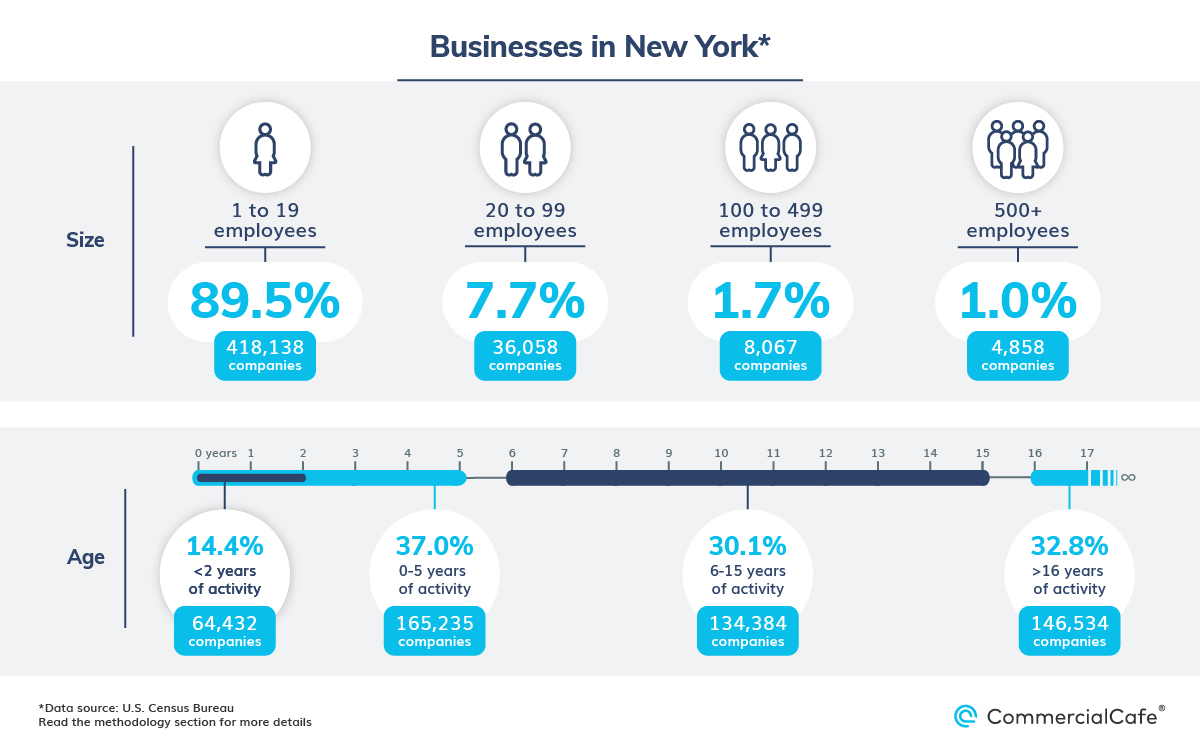
Finally, some 418,138 firms have less than 20 employees in New York, while 4,858 have a staff of more than 500 workers. And, while roughly 37% of companies have been active for at least five years, 14.4% of those have yet to celebrate their two-year anniversary in business.
Attracting top talent is paramount to the success and longevity of businesses today. With many workers prioritizing flexibility in the workplace, there has never been a better time for exploring shared office options in your area. Use CommercialCafe’s intuitive and extensive database to check out some of the best coworking spaces in New York City.
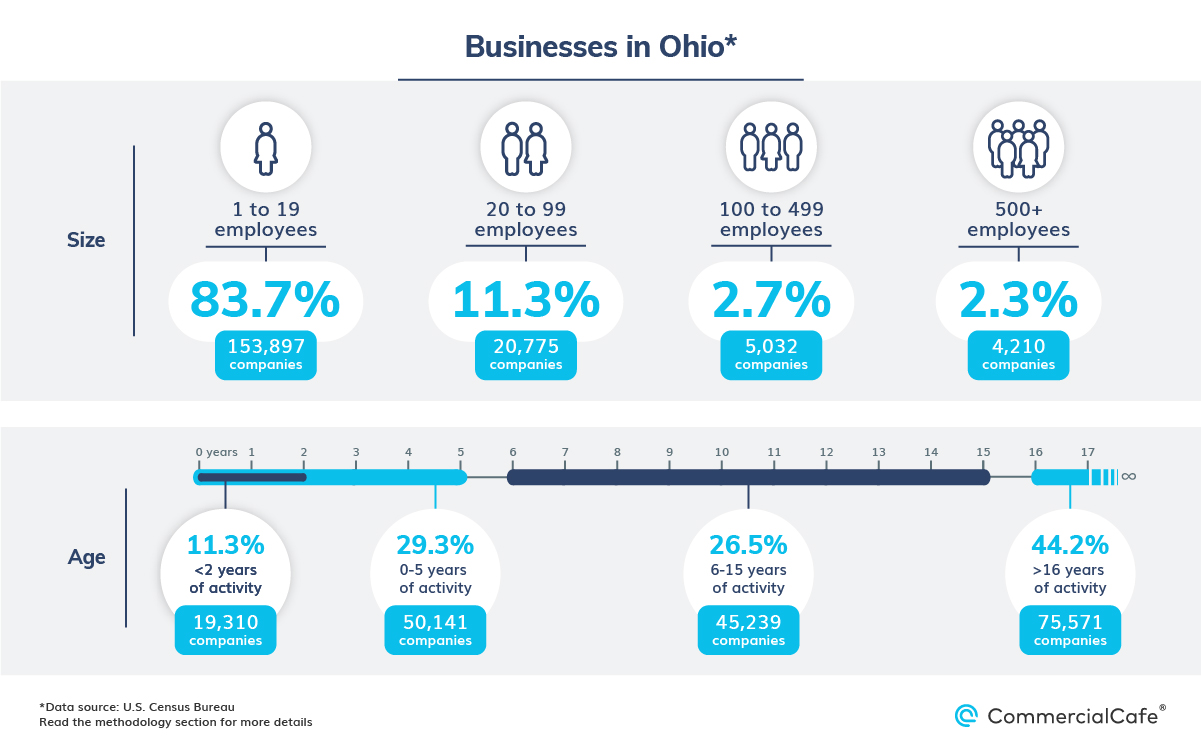
Ohio lost an estimated 16,000 businesses between 2008 and 2018 — the largest number nationally. Specifically, the state recorded significant losses within the retail; construction; health; and professional, scientific and technical services sectors. In these industries, roughly 7,775 firms disappeared throughout the decade.
An estimated 2.7 million Ohioans work in companies with more than 500 employees — the second-largest number of people working for businesses of this size in the Midwest, just behind Illinois. At the same time, firms with up to 20 employees constitute 83% of the total businesses in Ohio and create jobs for 13% of the local labor force.
Notably, a majority of companies in the state have an average age of 16 years or more. In fact, Ohio holds the fourth spot nationally for the total share of such businesses within the local economy, behind West Virginia, Vermont and North Dakota.
Attracting top talent is paramount to the success and longevity of businesses today. With many workers prioritizing flexibility in the workplace, there has never been a better time for exploring shared office options in your area. Use CommercialCafe’s intuitive and extensive database to check out some of the best coworking spaces in Columbus, coworking spaces in Cincinnati, or coworking spaces in Cleveland.
Business activity in Texas has been remarkable throughout the decade following the 2008 financial crisis, as the state experienced substantial gains across multiple industries. Specifically, the number of businesses grew by roughly 56,000 — a 14% increase during the 10-year period, the largest percentage hike across all 50 states — reaching a grand total of 452,000 firms by 2018.
Of those 56,000 companies, roughly 11,000 were in the professional, scientific and technical services sector, which grew by about 20% during the decade. And, while California still remains the number one spot for business creation in this industry, Texas’ recent growth has transformed the state into the closest contender for the role of the nation’s economic powerhouse — as well as a favored location for many startups eager to burst onto the scene.
Meanwhile, in the construction sector, the number of active firms went from 41,154 to 45,735 between 2008-2018. Notably, that 11% jump ended up being the largest increase for firms in this sector at the national level, as well, outranking both Florida and New York.
Additionally, throughout the last decade, the largest metropolitan areas in Texas have become net beneficiaries of migration patterns — both within and from outside of the state. Enticed by the business-friendly environment, many entrepreneurs chose to establish their ventures locally. And, as the number of people seeking accommodations or office space for rent in Austin, Houston or Dallas grew, so did the number of companies operating in the real estate, rental and leasing industry. In this sector, Texas had a net gain of 4,500 firms in the 10-year period — the third-largest increase nationally for this industry.
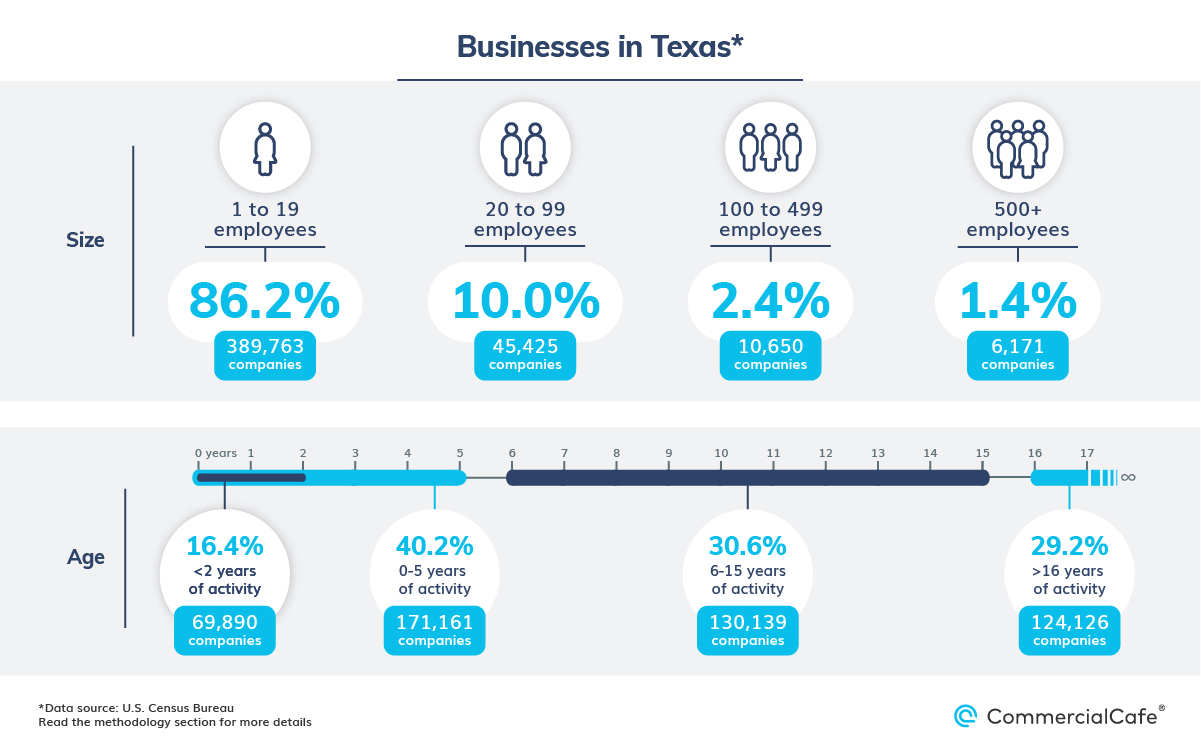
Conversely, the post-recession churn rate for companies in the state was fairly low and, beginning in 2012, Texas growth really kicked into high gear: By 2018, the business-to-population ratio was 1,482 firms per 100,000 residents — 244 of which were young enterprises with less than two years of history. As a matter of fact, Texas is among the top three U.S. states for young businesses that have been active for less than five years.
Alternatively, there are approximately 124,126 companies with more than 16 years of activity in Texas, representing 29% of the total number of businesses. Consequently, Texas has one of the lowest percentages of established firms in the U.S., alongside states such as Nevada, Florida, Utah, Arizona and California.
Attracting top talent is paramount to the success and longevity of businesses today. With many workers prioritizing flexibility in the workplace, there has never been a better time for exploring shared office options in your area. Use CommercialCafe’s intuitive and extensive database to check out some of the best coworking spaces in Austin, coworking spaces in Dallas, or coworking spaces in Houston.
Among states in the West, Utah secured the first position for percentage growth of total businesses between 2008-2018. And, its 14% increase meant an additional 8,682 firms by the end of the decade for the state, with particularly notable hikes in the regional health sector, as well as professional, scientific and technical services.
According to the latest data, the firms-to-population ratio in Utah is around 2,104 per 100,000 residents, of which roughly 354 companies have been in business for less than two years.
Attracting top talent is paramount to the success and longevity of businesses today. With many workers prioritizing flexibility in the workplace, there has never been a better time for exploring shared office options in your area. Use CommercialCafe’s intuitive and extensive database to check out some of the best coworking spaces in Salt Lake City.
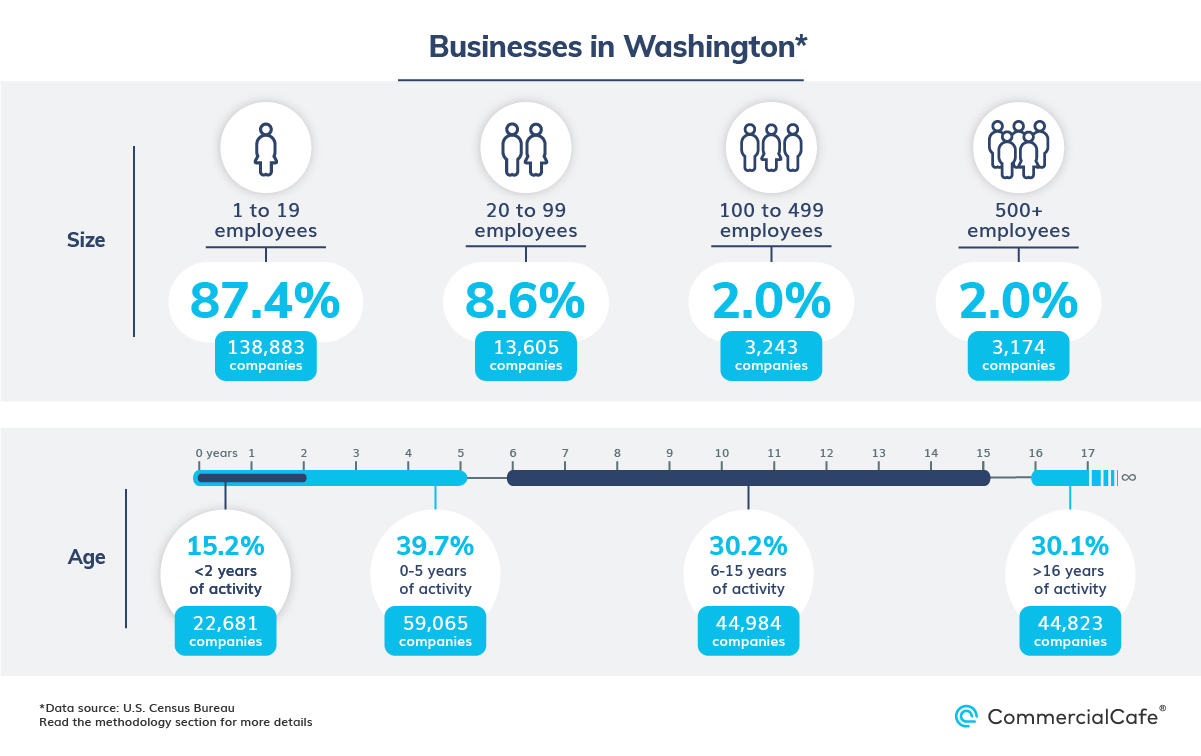
The total number of active firms in Washington state since the last recession increased by roughly 8,000 — a 5% bump in a 10-year period. In particular, the healthcare; real estate rental; and professional, scientific and technical service industries were the most prolific in terms of the number of businesses added between 2008-2018.
Here, approximately 87% of Washingtonian companies employ fewer than 20 people, creating jobs for 19% of the state’s total workforce. At the other end of the spectrum, large businesses with more than 500 employees make up just 2% of Washington’s business landscape. Nevertheless, nearly half of the state’s working-age population is employed by companies like Boeing, Microsoft or UW Medicine.
Attracting top talent is paramount to the success and longevity of businesses today. With many workers prioritizing flexibility in the workplace, there has never been a better time for exploring shared office options in your area. Use CommercialCafe’s intuitive and extensive database to check out some of the best coworking spaces in Seattle, coworking spaces in Tacoma or coworking spaces in Bellevue
CommercialCafe is a commercial real estate internet listing service, part of Yardi’s network of platforms. Whether you’re looking for office, warehousing or retail space in any of the major U.S. markets, we can help you find the best solution for your business needs.
Methodology
This analysis uses U.S. Census Bureau data from the Annual Business Survey and the statistics of U.S. businesses to calculate:
- The number and percentage share of companies in different size buckets (as determined by their number of employees) within each of the 50 states and the District of Columbia.
- The percentage share of employees working for companies in these different-sized buckets out of each state’s overall employed labor force.
- The firm density indicator, which highlights the ratio of the total number of companies to 100,000 residents in each state.
- Number and percentage of businesses across industry sectors, as well as differences between 2008 and 2018 values.
The latest U.S. Census Bureau statistics for these metrics are from 2018.


